What Would You Do With 10K?
A week ago, it was payday. But not just any ordinary payday, the big one! My year-end bonus was deposited in my bank account. The product of a long and hard year where I truly earned each dollar. Why do I do that? I’ll tell you here; it’s my little secret ;-). I’m not the kind of guy who wants to win contests (been there, done that), not the guy who wants to tell all his colleagues he’s the best and not the guy who’s looking for my boss’ appreciation. I’m simply the kind of guy who works hard to earn a big fat check at the end of the year.
I won’t disclose my real bonus, the title is completely phoney and not the point of my article anyways. The point is; what would you do with a lump sum deposited in your account? Tax season is approaching and you might want to ask this question for a smaller amount anyway. I didn’t always spend my money wisely or the way I should have done it. In fact, many of my bonuses were used to treat myself (like going to Hawaii last year with my wife!). But this year, I’ve tried to make sound decisions.
The Eternal Question; Pay Your Debt or Invest?
My first thought was to make a huge contribution to my TFSA and invest this money in the stock market. After all, I could easily create a 4% dividend yield portfolio right now with the recent volatility. On the other hand, I still have a couple of loans that I’ve carried for the past two years. One was used to install a central AC in my house and the second one was for the pool. You can tell, these were priorities back then ;-). The first point to settle when you are wondering if you should pay down your debt or invest is how much interest you pay vs how much return you can expect. Considering this rule, I should have invested the money in my TFSA since my expected return is greater than the loan interest.
However, I’ve decided to pay both loans and clean my balance sheet of consumer debts. The second point is to consider your current financial goals; do you wish to decrease your monthly payments or increase your balance sheet. Right now, I’m in the middle of my 18 month countdown before I retire and go live in an RV for a year. I don’t want to have any loans hanging over my head during that period. This is why I’ve decided to pay off my debts.
I now have three debts; my car loan, my RV loan and my mortgage. My car loan will be paid off by selling my car in 2016 and my mortgage along with my RV loan will also be cleared by selling my house. If I’m lucky, I’ll even have about 50K in cash once I become “debt free”. That’s a pretty solid plan since I expect to spend roughly $2,000 per month in my RV, this means I can easily live 12 months without even trying to make a penny with my websites…
Crazy Idea: Invest in a Margin Account
While I think I’ve made the right and foremost conservative decision, I’ve also looked at the possibility of taking my money in a margin account to almost double my investment. But I’ve made the following calculation to see if it was worth it:
Assume an investment of $10,000 with a margin at 70%. If I want to give myself some room for volatility, I can’t invest more than $30,000 (9K cash + 21K from the margin) and leave 1K in cash to cover for a potential margin call. So what can I do with 30K? Let’s say I do the best case scenario possible and make 20% return on it. This means I make $6,000 in a single year. That’s pretty amazing when you think about it in term of return (that means a 67% return on my initial investment of $9,000). But does it really change my life for a year considering all the risks taken?
I’ve leveraged several times in my life and it almost always paid off. However, with three kids and a financial future that is uncertain, I would rather play it safe this time. I might want to do it when I leave with my RV as I will live from my websites and investments, but for now, I would still rather pay off all my debts. I will keep the idea of leveraging with a margin account for next year, what do you think? Have you ever traded on margin?
Enbridge (ENB) Vs Transcanada (TRP)
A few weeks ago, a member of Dividend Stocks Rocks enquired about Enbridge and Transcanada. Since both companies are trading on the same symbol on both US and Canadian market and that they are at the center of the attention with the Keystone XL pipeline, I thought it worthwhile to take a look at them.
While small oil companies cut their dividends and oil exploration related companies saw their contracts cut, there is still a type of company related to oil that is providing immediate growth potential: pipelines!
The pipeline industry is quite simple; it’s costly and complicated to put it in place (just look at the Keystone XL pipeline saga), but once it is open; the owner charges a price per barrel going through it. The best part; the flow of oil moving through pipelines is very stable. Therefore, it’s like having a direct line with a never-ending ATM. After reading this paragraph, you are probably going to ask: Mike, if pipelines are such an amazing dividend payers, why is it that both ENB and TRP are NOT part of your DSR portfolios? This is a worthy question. Let’s take a look at both companies to see why we haven’t picked them.
Enbridge (ENB)
Enbridge Inc transports and distributes crude oil and natural gas. It is also engaged in natural gas gathering, transmission and midstream businesses and power transmission.
When I first looked at Enbridge’s DSR profile, I wasn’t impressed….
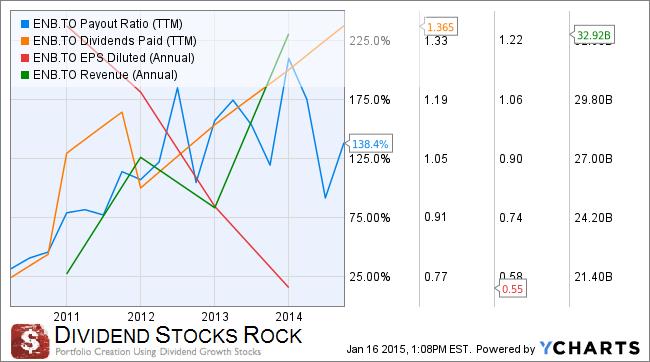
Very high payout ratio, ever dropping EPS and hectic revenues. This doesn’t sound much like a never-ending ATM to me! The company struggles to show consistent fundamentals while trading at a very high P/E ratio (around 62). While their business model definition inspires trust and conservative investment; their fundamentals do not speak the same language.
Then, we decided to dig further and look at ENB’s website and presentations. Here’s what we got from their 2015 Guidance Conference Call:
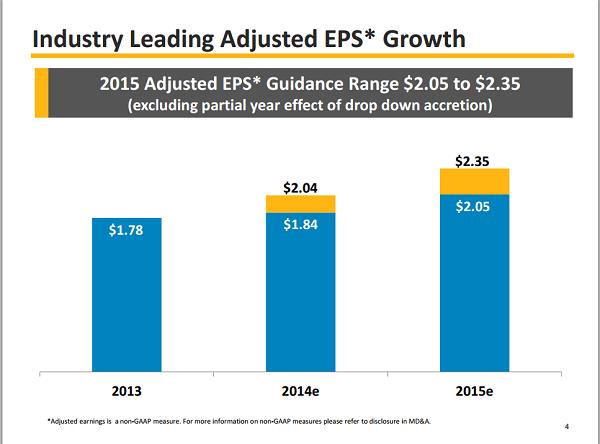
They use non-GAAP measures to adjust their earnings and show you they continue to make more money than before. Then, I looked at their statement of earnings to understand what is going on. I found that from 2012 to 2013, ENB operating income dropped by 14% due to higher expenses. I also looked at their cash flow to see if the pipeline was really growing the cash (keep in mind that EPS is based on accounting principles where the cash flow statement is king for any business). Well… due to a very high amount of investment, the cash flow statement is also lower in 2013 from 2012. There are good news related to this statement; #1 operating activities generate more cash flow than before and #2 if ENB invest massively, it also means they expect to make more money in the future.
I’ll be honest with you, I’m not a pipeline expert. Therefore I had to search throughout many documents to find why and how ENB was able to play some magic with their earnings and post growth while I see a big downtrend from Ycharts. Here’s their definition of adjusted EPS (source Yahoo Finance):
“The adjusted earnings discussed above exclude the impact of unusual, non-recurring or non-operating factors, the most significant of which are changes in unrealized derivative fair value gains and losses from the Company’s long-term hedging program and gains on the disposal of non-core assets and investments, as well as certain costs and related insurance recoveries arising from crude oil releases.”
Let me translate this for you: from my understanding, this means; the pipeline business continues to generate higher and higher profits but the hedging strategies around oil prices and the disposal of various assets/investments hurts their profit big time… year after year. There is one thing I’ve learned from EPS. Yes, it is based on accounting principles and you can trick them from time to time. However, you can’t trick them forever; if the business is making more and more money, at one point in time, the EPS will follow. This isn’t happening with ENB. After this analysis, you probably understand why ENB is not part of any DSR portfolios.
Transcanada (TRP)
All right, now, let’s take a look at TRP DSR Profile:
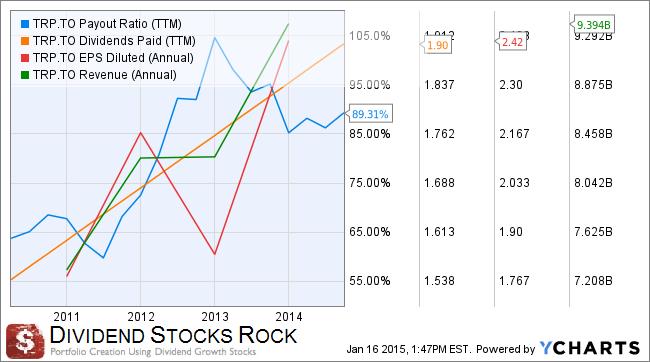
At first glance, TRP’s fundamentals look a lot better than ENB. What really catches everybody’s attention right now is more if the Keystone XL project will happen or not. While the State Department looked at the project, it published a positive report saying it would have minimal impact on environment. However, they also mentioned that if the oil prices were to fall below $70, “price below this range would challenge the supply costs of many projects”. We all know Obama is not too eager to see this pipeline crossing the USA and, according to some, would result only as a benefit to Canadians. For now, the best move for any investor would be to look at TRP and exclude the pipeline perspective. If Keystone XL happens, than you can simply add this to your “best case scenario”. Since TRP can also look at its other project (Energy East) that goes across Canada instead of into the US, you can bet TRP will eventually get a pipeline… From the graph found on the next page, you can clearly see that TRP’s pipeline diversification doesn’t stop at Keystone XL or Energy East by any means (source TRP presentation):
In their most recent presentation, TRP expects to double its dividend growth rate from 2014 to 2018. For the past two years, it shows a 4% dividend growth and it should bump up to 8% annually. This wind of optimism is due to successful small to medium-sized projects (e.g. not major pipelines). If this would happen, the dividend growth might grow even stronger post 2018.
Overall, if I had to choose between Enbridge and Transcanada, I would definitely buy TRP. TRP’s fundamentals are stronger, P/E ratio is smaller (62 vs 21) and dividend yield is higher. On top of all this, TRP has a lot of upside potential in the event of one of the two major pipelines get approved.
My 2014 Year in Review and Portfolio Asset Allocation
A couple of weeks ago, I listed my personal goals for 2015. It will be a very busy year as I expect to retire from my day job in 2016. But besides my personal goals, I also have to take care of my investments! Let’s take a look at how I did in 2014…
2014 Portfolio Review
I’m quite satisfied with my investment return in 2014. At one point in time, I was almost beating my 2013 return! But then the price of oil sunk and hit my portfolio. I finished 2014 with a respectable +16.4% (including dividend). My portfolio pays a current dividend yield of 2.79%. This seems pretty low, but that’s because several of my picks went up greatly in the past two years (I’m over +30% since January 2013). Another interesting fact is all companies I hold raised their dividend in 2014.
My best moves in 2014 were to increase my position in Apple (AAPL) and keep investing my new money in US stocks. As a Canadian, this boosted my return since the Loonie kept losing feathers to the Greenback. Apple is just an amazing company and it will continue to rock the mobile market now that Samsung is experiencing margin problems due to its “shoot everywhere and hope to kill” marketing strategy.
Among my best performers (besides AAPL at +39.69% before dividend), I have Lockheed Martin (LMT) (+31.83%) and Disney (DIS) (+23.50%) with high returns excluding dividend. I have also many companies showing small double digits returns including dividend (JNJ, NA.TO, GS.TO, T.TO, WMT).
My worst moves (so far) were to sell CVX and HSE and replace them with two oil related companies: Helmerich & Payne (HP) and Black Diamond (BDI). So far, both stocks are down the drain since the price of a barrel can’t stop falling. HP drills wells so investors are afraid the company may lose exploration contracts and Black Diamond rents modular equipments/homes and their major clients are oil sand exploration companies in Alberta. Numbers should be all right in 2015 since both companies will continue to honor their current contracts. However, I don’t expect a dividend increase this year for these two stocks. As long as oil prices remain volatile, they will be a heavy weight in my portfolio that I have to carry. At least, the dividend is good!
Asset Allocation Review
After working on my portfolio since 2010 to make it a 100% dividend stock investment in 2012, I have finally achieved a great diversification in terms of asset allocation:

68% of my portfolio is invested in US stocks compared to 32% in Canadian companies. My biggest sector is Consumer, cyclical with 18% followed by all other sectors between 13% and 14%. It’s a well balanced portfolio preventing any market hit on a single sector. Therefore, even if my two oil related stocks (HP and BDI) continue their drop in 2015, it won’t affect my portfolio much (combined together, they are worth less than 9% of my portfolio.
Since I expect to sell everything and leave on my RV trip, I don’t plan on adding new money in this portfolio for 2015. This will be the first year I skip an RRSP contribution. I prefer to use my money to pay off all my personal debts in order to improve my financial situation before I leave. The plan is to sell everything and keep roughly 50 to 60K invested (on top of my RRSP). I’ll have 0 debt and don’t plan on withdrawing money from the 50-60K either. Therefore, upon my return in late 2017, I should have enough cash for a down payment to buy another house!
There are a few companies I’d like to add to my portfolio at the moment but I’m also happy with the ones I have in hand right now. Therefore, I don’t expect to trade much in this portfolio, sadly!
Investment Return Expectation
I’m pretty confident in the US economy for 2015 and since my portfolio is almost 70% invested in US stocks, I’m looking to get another double digit return this year, what are your return expectations?
Wells Fargo – a Social Bank with Potential
During the 2008 financial crisis, all US banks dropped like a rock. All of them? Not really, there was one bank that survived this catastrophic year and even posted a small gain of 1.31%. While the S&P 500 lost 37.6% and the worst banks such as Citigroup (C ) and Bank of America (BAC) lost 76.8% and 65.30% respectively, the “Warren Buffett bank”, Wells Fargo (WFC), bought Wachovia banks and became the 4th largest bank by assets and the largest bank by market capitalization.

But not everything was perfect for WFC. In early 2009, the bank cut its dividend by 85% and was showing a negative return of -71% from January 1st 2009 to March 6th 2009. It wasn’t doing much better than its peers.
Now that the financial crisis is definitely over and interest rates are about to move higher again in 2015, Ben from Sure Dividend and I decided to analyse two strong banks; JP Morgan Chase (JPM) and Wells Fargo (WFC). Below you will find my analysis of Wells Fargo. Click on SureDividend’s JP Morgan Chase analysis here.
Business Model
Wells Fargo & Co is a diversified financial services company. It provides retail, corporate and commercial banking services through banking stores and offices, the internet and other distribution channels to individuals, businesses and institutions.
Wells Fargo has put customer service among its top business priorities a while ago. It is known for its sustainable & responsible business approach and was recently voted #1 best bank in customer service for the past two years. According to a study made by the AMA (American Marketing Association), top customer service business tops the market all the time (full research here).
But the bank is not only friendly to its customers, it’s also everywhere across the United States and has a very strong sales force:

Source: Wells Fargo Investors Relation Website
They are now #1 for mortgages, middle market commercial loans, small business loans and auto financing. On the flip side of things, they are “only” #3 for brokerage services and #4 for wealth management (based on AUM).
Now let’s go dive further into the numbers. Following the first 4 Dividend Stocks Rock Investing Principles, I’ll take a look at Wells Fargo and share a full dividend analysis.
Principle #1 High Dividend Yield Doesn’t Equal High Returns
Did you know that the highest dividend yield stocks underperform more “reasonable” yielding stocks? The Hartford Mutual Funds company wrote:
The study found that stocks offering the highest level of dividend payouts have not performed as well as those that pay high, but not the very highest, levels of dividends.”

Read more about this research here.
Wells Fargo dividend yield is definitely not among the highest. With a dividend yield under 3% since mid 2009, you won’t be a happy camper if you are looking for a high dividend yield. However, if you look at both before and after the 2008 crisis, the dividend yield is relatively stable:
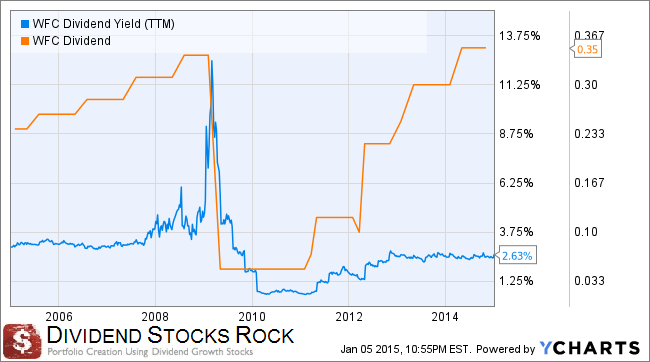
It was hovering slightly over 3% before the crisis and it is now quite stable around 2.75% since the end of 2012. The orange line of the graph shows you that while the dividend yield is stable, the payout is consistently increasing if you ignore the crisis (once again). What does this mean? Bigger payouts and higher stock return as the yield remains almost unchanged.
Principle #2: If There is One Metric; It’s Called Dividend Growth
If I had to go blindfolded to pick a stock and have only one metric to look at, I would pick dividend growth. This is the most important metric to me as it is a clear sign of the company’s financial health and its ability to pay me for years to come. Here’s an interesting quote from Saturna Capital:
“Indeed, dividend growth has been a much larger determinant of equity returns in this new era of low benchmark rates and higher levels of uncertainty.”

You can get the full detail here.
The WFC dividend growth story shows 21 consecutive years (from 1988 to 2009) of dividend increases. It was so close to becoming a dividend aristocrat and everything was thrown in the trash when the company cut its dividend by 85% to save its balance sheet and some previous liquidity. Good news is, the company quickly got back on their feet and grew back the dividend payout to where it was in only 5 years:

As you can see, patient investors didn’t have to wait that long to see the dividend come back. Now that the US economy is back on track and that the American consumer has less debt and is more inclined to spend, the loan business should do very well in 2015.
Principle #3: A Dividend Payment Today is Good, A Dividend Guaranteed For the Next 10 Years is Better
I think it’s very important to cross the payout ratio with the dividends paid over at least 5 years to see where the company is going with its dividend policy. It’s a key indicator to know if the payout will continue to increase or if it will reach a plateau at one point in time.

You will notice something very interesting when you do the exercise for the past 10 years. The dividend payout is back to where it was in 2009 but the payout ratio is 20% lower. In other words, the company’s ability to pay dividends is stronger today than it was right before the crisis. Over the past 5 years, the dividend increased by 600% while the payout only increased by 45%. There is definitely some accounting tricks here (as provision for bad debts swung big time during that period), but still, the company is now stronger than ever.
Principle #4: The Foundation of Dividend Growth Stocks Lies in its Business Model
A company that doesn’t have a sound business model won’t be able to sustain consecutive dividend increases over the long haul. On the other hand, businesses which pay dividends and increase them will outperform other stocks:
Source: Edward D. Jones – Dividend Stocks Rock
Now how can you find these marvels? This is why you need other financial metrics to identify companies that will be able to sustain and increase their dividend for the next 10 years. At DSR, we look at the 3 and 5 year metrics for Sales and Earnings per Share (EPS) growth. We only select companies showing positive growth over both the 3 and 5 year periods. Since an economic cycle lasts between 5 and 8 years, a strong company should be able to post increasing sales and earnings over these periods. I’m using both EPS and Revenue data from Ycharts:
DSR STOCK METRICS
3 year revenues = -0.56% Fail
5 year revenues = 14.88% Pass
3 year EPS growth = 20.74% Pass
5 year EPS growth = 40.92% Pass
Due to hectic numbers over the past 5 years, WFC hasn’t shown on our “DSR Radar”. I usually look for smoother trend lines when I look at EPS, Dividends and Revenues growth. It wasn’t the case for Wells Fargo over the past few years, but it doesn’t mean it will be the case for the future. Since the US economy should remain strong and this bank is a leader in many core products, WFC could be an interesting play for the years to come. After all, investing is not about what happened yesterday, it’s about what it will happen tomorrow.
A Look at the Most Recent Results
Wells Fargo delivered its Q4 earnings on January 14th. The bank is showing slightly higher than expected EPS and revenues. EPS are at $1.02 (compared to $1.00 last year) while $1.01 was expected. Revenues also beat expectation by 200M$. Wells Fargo Chairman and CEO John Stumpf had the following comments: “Wells Fargo had another strong year in 2014, with continued strength in the fundamental drivers of long-term performance: growing customers, loans, deposits and capital. As a result of this performance, we were able to return more capital to our shareholders during the year. Our success is the result of our 265,000 team members remaining focused on meeting the financial needs of our customers in the communities we serve. As the U.S. economy continues to build momentum, I’m optimistic that our diversified business model will continue to benefit all of our stakeholders in 2015.”
As mention in this analysis, WFC benefits from its “classic” loan business in a growing economy. Wells Fargo’s great ability to cross sell better than its competitors enable the bank to cut price and be more competitive. They offer better pricing to their clients while making more profits than their competitors by selling more products (with a smaller margin). It’s a win-win situation between a bank and customers!
Disclaimer: I do not personally hold WFC shares at the moment of writing this article. Also, WFC is not held in our Dividend Stocks Rock Portfolios.
All Banks Portfolio – Genius Idea?
If I tell you that you can build an everlasting portfolio with minimum effort that has beat the Canadian S&P TSX for the past 20 years and will pay on average 4% in dividends, would you become my client? And this portfolio currently pays a 4.14% dividend yield.
Fortunately, you don’t have to pay me for building this portfolio. In fact, you don’t need much…. Just a crazy thought. Since I’m a nice guy, here it is; I’ll give you the ultimate trading secret portfolio managers want to hide from you.
Here’s the crazy idea: why don’t you fire your broker, sell all your stocks and mutual funds and buy the big 5?
Say what? Yes: there is an investment philosophy (that is not ready to stop) showing the simplest investments with one of the highest returns. All you have to do is to buy the five biggest banks of Canada:
TD Bank (TD)
Royal Bank (RY)
ScotiaBank (BNS)
CIBC (CM)
BMO (BMO).
Good news for US investors; you can buy Canadian banks on the NYSE as well! There is no reason why this is not a good investment strategy. After all;
#1 Canadian banks form the strongest banking system in the world
#2 They evolve in a heavily regulated country where the Government protects them from themselves
#3 Canadian banks barely suffered from the 2008 credit crisis
#4 They are among the first ones to increase their dividends, year after year.
#5 Canadian banks are part of a comfortable oligopoly where their business is not threatened by foreign players.
#6 Canadian banks trade at a low P/E ratio helping their dividend yield beat inflation.
Before I keep going, I must tell you that I’m not the one who discovered this fantastic investing strategy. In fact, Peter, a long time Dividend Guy Blog’s reader, sent me two articles from the Globe & Mail asking for feedback:
Should I bank on all-bank portfolio?
Why an all-bank portfolio is bonkers
In short, the author tells you it’s not a good idea in the first article and keeps telling you the same thing in the second post after reading so many comments from bank lovers. As you probably realized by now; I’m being sarcastic; there are millions of reasons why investing it all in the big 5 is a VERY BAD IDEA.
John Heinzl, the G&M journalist, gives a pretty good explanation but I thought I would demonstrate my point of view with a single analogy. I’ll compare the insurance and the investment world for a second. By investing all your money into 5 stocks, you ignore the diversification principle to make more money based on the past 20 years of data. In financial theory, the diversification principle works as insurance on your portfolio that you won’t lose everything tomorrow morning. Here’s the comparison with the insurance world:
Let’s take my situation for example; I’m 33, married with 3 kids. I make about 4 times my wife’s income and we have a mortgage and a car loan. I could decide to not buy insurance. After all, what are the odds of a healthy non-smoker 33 year old man of dying in the next 12 months? Barely none, right? So why do you think I’m insured anyway? There is a huge difference between the word “hazard” and “risk”.
Searching through the business dictionary, you will find the following definitions:
Hazard: Condition or situation that creates or increases chance of loss in an insured risk, separated into two kinds: Physical hazard and Moral Hazard.
Risk: A situation where the probability of a variable (such as burning down of a building) is known but when a mode of occurrence or the actual value of the occurrence (whether the fire will occur at a particular property) is not. A risk is not an uncertainty (where neither the probability nor the mode of occurrence is known), a peril (cause of loss), or a hazard (something that makes the occurrence of a peril more likely or more severe).
Source (Business Dictionary)
So my situation (hazard) doesn’t really increase my chance of dying in the next 12 months. However, the impact of death on my family’s financial situation (risk) is too important to ignore.
If you invest all your money into Canadian banks, your hazard is not too big. However, the risk of losing 50%+ of your money during a crisis is too important to leave your portfolio unprotected from it.
The world is full of individuals who haven’t paid a cent in insurance and that are now 60, 70 or 80. Imagine all the money they have saved! But for the few who died uninsured in their 30’s or 40’s, ask their families what they went through.
In 1998, nobody thought that GM, the world biggest car constructor would fail 20 years later. Nobody thought that Lehman Brothers, a more than century old financial institution would bow down on their knees one day. Who knows what is going to happen to Canadian banks in the next 20 years from now. I’m not taking the risk to go through it!
All bank portfolio investors; please tell me why you sleep well at night?
© Copyright 2013 Adividend