Add Economic Moats to Your Stock Analysis
April 25, 2024
blog, competitive advantages: economic moats, economic moats, economic moats: what are, narrow moat, Stock Analysis, stock analysis: review economic moat, wide moat
0 Comment
Adding economic moats to your stock analysis can help you to develop and be confident in your investment thesis, i.e., why a stock is a good pick for your portfolio. A company’s economic moat can also shed light on loser stocks you have and don’t know what to do with.
 A moat is a ditch, either dry or filled with water, surrounding a castle or town, that acts as a primary line of defense. Historically, moats were used to protect our most precious asset: where we live.
The term economic moat refers to the factors that help a company survive and thrive, and how long these factors will exist. In other words, what keeps the castle standing and for how long. Is the castle protected by a moat and structures that are wide and built to last, or is it without a moat, still standing only because the lord of the castle is a genius that no one wants to or can take down for now?
Let’s dig in.
Protection offered by economic moats
An economic moat is a lasting competitive advantage that makes a company better than the others. A wide and durable economic moat helps a company ward off competition and makes it easier for it to generate above-average returns for years.
What constitutes an economic moat for one company or industry differs from another. Morningstar identifies different types of protection that constitute economic moats:
- Switching costs that make it too difficult or costly for customers to switch from one supplier to another. A company enjoying this type of protection is said to have a sticky business model.
- A network effect that makes a product or service more valuable and appealing as more people use it. It’s a snowball effect; as more people buy the product, the company improves it, making existing customers happier and drawing in new customers. Rinse and repeat.
- Intangible assets include patents, trademarks, brand recognition, and proprietary technology.
- Cost advantages refer to the ability to produce goods or services more cheaply than the competition. Just think about Amazon or Walmart.
- Efficient scale means that the market where a company operates limits the number of competitors, for example, regulated utilities that are granted a monopoly over a region.
A company can have more than one of these types of protection in its armor. Stay tuned. Articles in the next few weeks will explore these types of economic moats in detail.
Get great stock ideas regularly. Download our Rock Stars list.
How long will the moat last?
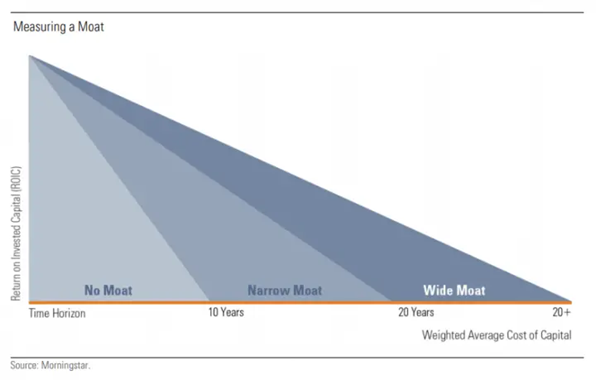
Another aspect of economic moats is how long they will last. Some advantages could quickly evaporate while others may remain for a long period. Patents expire, someone can develop better proprietary technology, and governments can step in to open up competition in monopoly or oligopoly situations. Morningstar classifies moat life expectancy as follows:
Wide moat (20+ years)
A wide moat is one or more long-lasting competitive advantages, expected to be effective for 20 years or more. For example, railway companies aren’t likely to see competitors build an alternative railroad alongside theirs overnight, if ever.
Narrow moat (10 years)
Narrow moats are competitive advantages that exist today, but that might not continue in the future. Interpretation could come into play; for example, Morningstar gives a “narrow moat” rating to Enbridge, despite its contracts being usually for over 20 years. Morningstar says “We are far more uncertain around long-term demand in the latter stages of our forecast due to the high carbon emissions intensity associated with the full cycle of oil sands production, which is a primary source for Enbridge’s assets”.
No moat
Companies with no clear competitive advantage, or with some that will quickly dissipate, have no moat.
Impact of moat duration
Why is the moat’s life expectancy important in your analysis? Because it determines how much time you have to generate profit from your investment. When you invest in a company with a wide moat, you have a longer horizon to make money since the business will benefit from competitive advantages for a long time.
In contrast, a company that has no moat, such as Peloton, has little time to generate a maximum profit before competitors see the opportunity and enter the market. Since there’s no protection, the castle can easily be taken by force.
Next week, we dive into the types of moats, or competitive advantages, in more detail.
Are companies with economic moats good investments?
Not necessarily. Some companies don’t have long-lasting moats or none at all, but are still amazing. Some companies show a wide moat yet end up reporting terrible results. Here are a few examples:
- AT&T (T) has a narrow moat according to Morningstar but has shown terrible returns over the past 10 years (32% total return).
- Equinix (EQIX) has a narrow moat rating but generated 485% in total return during the same period.
- Great-West Lifeco (GWO.TO) has no moat and generated a 121% total return.
A company’s moat is just one of the things to consider.
Get great stock ideas regularly. Download our Rock Stars list.
Finding information about company moats
Here are some resources where you can read about companies’ economic moats:
- Investment websites and blogs: Sites like this one! Also, the investment thesis on the Dividend Stocks Rock stock cards mentions the competitive advantages of companies. Morningstar, Seeking Alpha, and Investopedia publish articles and analyses discussing companies’ economic moats.
- Financial news outlets: Bloomberg, CNBC, and the Wall Street Journal frequently cover companies’ competitive advantages and economic moats.
- Company reports and filings: Companies often discuss their competitive advantages and strategies in annual reports, investor presentations, and regulatory filings.
- Industry reports and analyst notes: Research reports from investment banks, equity research firms, and independent analysts.
- Business and finance magazines articles including those of Forbes, Fortune, and the Economist
Takeaway
After reading several economic moat ratings by Morningstar, I can’t say that I always agree with their analysis. Since the goal is to assess what could happen in the future, your interpretation of a company’s moat might differ from Morningstar’s or mine. Beauty is in the eye of the beholder.
That said, I like the concept of economic moats. It helps define a strong investment thesis and helps investors figure out if the dividend triangle will continue to grow based on the company’s competitive advantages. If you can’t find those advantages, those moats, the company is probably riding a short-term hype.
Thriving businesses have many things in common, including a strong dividend triangle along with a set of moats protecting the business. Next time you review a company’s dividend triangle, ask yourself if the business has a strong economic moat that will enable it to sustain its dividend triangle trend.
The post Add Economic Moats to Your Stock Analysis appeared first on The Dividend Guy Blog.
Short Selling, Profit Protection, Chowder Rule: What You Need to Know [Podcast]
April 24, 2024
Subscribe
Easy solutions can involve serious risks. Here’s what to consider before doing Short Selling, Profit Protection, and the Chowder Rule.
Download the Dividend Rock Stars List and Select Stocks Among the Best Assets! Enter your name and email to get the free spreadsheet.
You’ll Learn
- Short selling occurs when an investor borrows a security, sells it on the open market, and expects to repurchase it for less money.
- Why would an investor short-sell its shares? What are the benefits?
- The risks of this strategy are real and investors could lose a lot of money!
- Sometimes, an expert issues a short report that can create a lot of doubt in investors’ minds. A good example would be the recent one on Brookfield. What was the impact, and should investors follow such reports?
- Profit protection, also known as profit preservation or risk management, refers to investors selling their shares to safeguard existing profits or limit potential losses. Is this a good reason to sell, and why?
- What could investors do instead?
- It seems like short-selling and profit protection both evolve around the speculation, which you try to avoid. Why is it dangerous to speculate for investors?
- Now, let’s discuss the Chowder Rule, which many members use at Dividend Stocks Rock. What is it?
- Which minimum Chowder Score should investors aim at?
- The Chowder Rule is interesting for finding a balance between dividend yield and growth. But are there any disadvantages to using it?
- Mike ends the episode by adding a warning about easy solutions and the fact that there is no shortcut to be a successful investor.
Related Content
Investors’ main goal is to make a profit. So when your holdings go up 25, 50, or 75% and more, you may wonder if you should cash in your profit. Here’s when to sell your winners!
Here’s another podcast episode from the Moose on the Loose to present Mike’s point of view on sophisticated investment strategies.
Subscribe
The Best Dividends to Your Inbox!
Download our Dividend Rock Star List now and do not miss out on the good stuff! Receive our Portfolio Workbook and weekly emails, including our latest podcast episode!
Follow Mike, The Dividend Guy, on:
- YouTube
Have Ideas?
If you have ideas for guests, topics for The Dividend Guy Blog podcast, or simply to say hello, then shoot me an email.
This podcast episode has been provided by Dividend Stocks Rock.
![]()
The post Short Selling, Profit Protection, Chowder Rule: What You Need to Know [Podcast] appeared first on The Dividend Guy Blog.
Doubling Down on Telus in Smith Manoeuvre – March Dividend Income Report
April 19, 2024

In September of 2017, I received slightly over $100K from my former employer, representing the commuted value of my pension plan. I decided to invest 100% of this money in dividend growth stocks.
Each month, I publish my results on those investments. I don’t do this to brag. I do this to show my readers that it is possible to build a lasting portfolio during all market conditions. Some months we might appear to underperform, but you must trust the process over the long term to evaluate our performance more accurately.
Performance in Review
Let’s start with the numbers as of April 5th 2024 (before the bell):
Original amount invested in September 2017 (no additional capital added): $108,760.02.
- Current portfolio value: $245,539.73
- Dividends paid: $4,490.67 (TTM)
- Average yield: 1.83%
- 2023 performance: +20.69%
- SPY= +26.19%, XIU.TO = +11.87%
- Dividend growth: +1.7%
Total return since inception (Sep 2017 – April 2024): 125.76%
Annualized return (since September 2017 – 79 months): 13.17%
SPDR® S&P 500 ETF Trust (SPY) annualized return (since Sept 2017): 13.64% (total return 132.10%)
iShares S&P/TSX 60 ETF (XIU.TO) annualized return (since Sept 2017): 9.49% (total return 81.67%)
Smith Manoeuvre Update
Slowly but surely, the portfolio is taking shape with 10 companies spread across 7 sectors. My goal is to build a portfolio generating 4-5% in yield across 15 positions. I will continue to add new stock monthly until I reach that goal. My current yield is 5.13%.
Doubling down on Telus (T.TO) (adding 23 shares)
The goal of this portfolio is to spice up things a little and make plays on higher yielding stocks.
- I can use the interest paid to reduce my dividend income.
- There are some interesting long-term plays where companies like Telus could get back on track and generate solid returns.
Since Telus is on my buy list, I’m good with eating my own cooking. Watch my recent video about Telus and BCE to get my full analysis.
Here’s my SM portfolio as of April 5th, 2024 (before the bell):
| Company Name | Ticker | Sector | Market Value |
| Brookfield Infrastructure | BIPC.TO | Utilities | $895.00 |
| Canadian National Resources | CNQ.TO | Energy | $1,193.83 |
| Capital Power | CPX.TO | Utilities | $556.05 |
| Canadian Tire | CTA.A.TO | Consumer Disc. | $936.95 |
| Exchange Income | EIF.TO | Industrials | $1,542.72 |
| Great-West Lifeco | GWO.TO | Financials | $717.23 |
| National Bank | NA.TO | Financials | $674.82 |
| Nutrien | NTR.TO | Materials | $990.21 |
| Telus | T.TO | Communications | $1,319.74 |
| TD Bank | TD.TO | Financials | $1,134.70 |
| Cash (Margin) | $13.22 | ||
| Total | $9,974.47 | ||
| Amount borrowed | -$9,500.00 |
Let’s look at my CDN portfolio. Numbers are as of April 5th, 2024 (before the bell):
Canadian Portfolio (CAD)
| Company Name | Ticker | Sector | Market Value |
| Alimentation Couche-Tard | ATD.B.TO | Cons. Staples | $22,179.82 |
| Brookfield Renewable | BEPC.TO | Utilities | $8,485.62 |
| CCL Industries | CCL.B.TO | Materials | $9,452.80 |
| Fortis | FTS.TO | Utilities | $9,052.80 |
| Granite REIT | GRT.UN.TO | Real Estate | $9,600.00 |
| Magna International | MG.TO | Cons. Discre. | $4,961.60 |
| National Bank | NA.TO | Financials | $13,608.87 |
| Royal Bank | RY.TO | Financial | $8,890.05 |
| Stella Jones | SJ.TO | Materials | 11,700.44 |
| Cash | $906.79 | ||
| Total | $98,838.73 |
My account shows a variation of -$925.73 (-1%) since the last income report on March 1st.
Couche-Tard created a commotion!
It was a rare disappointing quarter for ATD and the stock price dipped by more than 5% on earnings day due to revenue being down 2.2% and EPS was down 12.2%. Total merchandise sales increased slightly by 1.6%, but fuel revenues were down 2.6% mostly driven by weak performances in Canada (-8.3%) and in the U.S. (-7.2%). There is a sign the economy is slowing down. The earnings decrease is primarily driven by lower road transportation fuel gross margins in the U.S. and softness in traffic as a portion of the customers remain impacted by challenging economic conditions. Management’s focus is on their most recent acquisition to generate synergies ASAP.
I’ve shared my thoughts more in depth in this Moose on The Loose Episode:
Here’s my US portfolio now. Numbers are as of April 5th, 2024 (before the bell):
U.S. Portfolio (USD)
| Company Name | Ticker | Sector | Market Value |
| Apple | AAPL | Inf. Technology | $6,755.60 |
| Automatic Data Processing | ADP | Industrials | $9,176.62 |
| BlackRock | BLK | Financials | $11,089.26 |
| Brookfield Corp. | BN | Financials | $13,754.30 |
| Home Depot | HD | Cons. Discret. | $10,730.40 |
| LeMaitre Vascular | LMAT | Healthcare | $6,377.00 |
| Microsoft | MSFT | Inf. Technology | $19,640.36 |
| Starbucks | SBUX | Cons. Discret. | $7,447.70 |
| Texas Instruments | TXN | Inf. Technology | $8,426.50 |
| Visa | V | Financials | $13,700.00 |
| Cash | $667.63 | ||
| Total | $107,765.37 |
My account shows a variation of -$2,936.13 (-2.65%) since the last income report on March 1st.
There wasn’t much news about this part of the portfolio this quarter. Last month I was up $3K, but this month I’m down $3K. It’s just the market dance ?. I’m making a mental note about BlackRock though. The company has reported two small dividend increases in the past couple of years. If it continues this way, I will have to sell my position and focus on companies with a stronger dividend triangle. I’m not in a hurry, but I’ll keep that in mind for early 2025 (when BLK usually announces its dividend increase).
My Entire Portfolio Updated for Q1 2024
Each quarter we run an exclusive report for Dividend Stocks Rock (DSR) members who subscribe to our very special additional service called DSR PRO. The PRO report includes a summary of each company’s earnings report for the period. We have been doing this for an entire year now and I wanted to share my own DSR PRO report for this portfolio. You can download the full PDF showing all the information about all my holdings. Results have been updated as of January 10th, 2024.
Download my portfolio Q1 2024 report.
Dividend Income: $677.05 CAD (-5.6% vs March 2023)
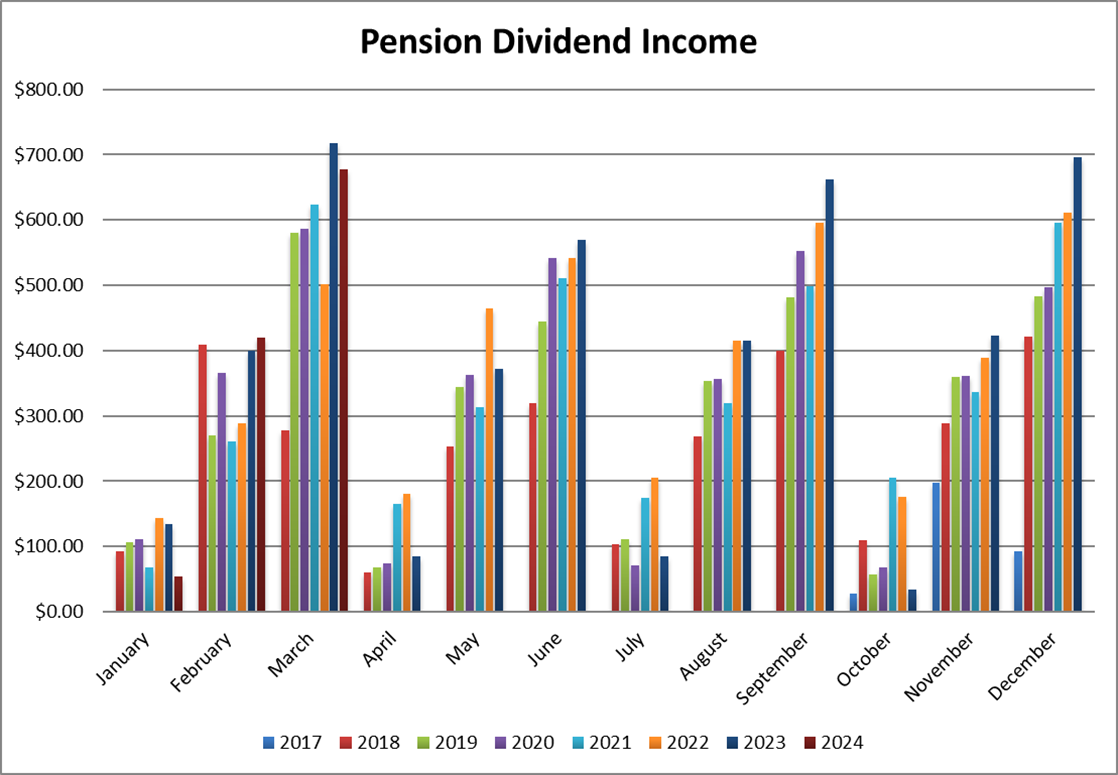
My dividend payout is slightly smaller than last year as I previously held Enbridge, a generous dividend payer. The loss of ENB’s dividend was partially offset by dividend increases along with new dividend payers in my portfolio with stronger dividend triangles, but weaker yields.
Brookfield Corporation, CCL Industries (I literally used ENB’s proceeds to buy CCL) and LeMaitre Vascular are the new dividend payers this quarter.
Dividend growth (over the past 12 months):
- Fortis: +4.4%
- Magna: +0.7%
- Granite: +3.1%
- CCL: new
- BEPC: +19.74% (added more shares)
- Visa: +15.56%
- Microsoft: -5.75% (sold some shares)
- Home Depot: +7.66%
- Blackrock: +2%
- LeMaitre: new
- Brookfield: new
- Currency: +0.0179%
Canadian Holding payouts: $345.17 CAD.
- Fortis: $100.89
- Magna: $44.19
- Granite: $35.20
- CCL: $40.60
- BEPC: $124.29
U.S. Holding payouts: $243.80 USD.
- Visa: $26.00
- Microsoft: $35.25
- Home Depot: $67.50
- Blackrock: $71.40
- LeMaitre: $16.00
- Brookfield: $27.65
Total payouts: $677.05 CAD.
*I used a USD/CAD conversion rate of 1.3613
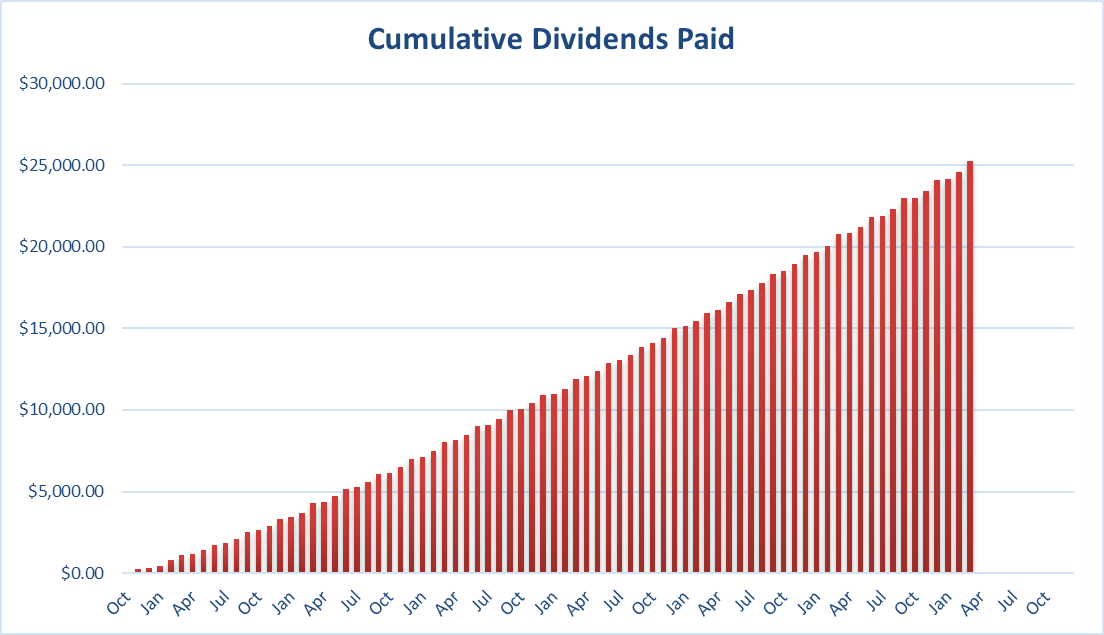
Since I started this portfolio in September 2017, I have received a total of $25,263.93 CAD in dividends. Keep in mind that this is a “pure dividend growth portfolio” as no capital can be added to this account other than retained and/or reinvested dividends. Therefore, all dividend growth is coming from the stocks and not from any additional capital being added to the account.
Final Thoughts
After doing this monthly update I realize I still have almost $2K in cash to reinvest in my portfolio! While it’s not a big amount, this money must be put to work! I’m getting close to making a decision on Magna International as it’s my smallest position in this portfolio (about 2%). I’ll be considering either selling the position or adding the full $2K to it.
While Magna Intl is an interesting play, there are a few Canadian stocks on my “wish list”. You’ll have to read my next update to find out what I’ll do with this dilemma!
Cheers,
Mike.
The post Doubling Down on Telus in Smith Manoeuvre – March Dividend Income Report appeared first on The Dividend Guy Blog.
CDRs, Are They Really Worth It? [Podcast]
April 17, 2024
Subscribe
It is frustrating to pay currency fees on investment. Many investors feel like a part of their money is lost and useless. Canadian Depositary Receipts (CDRs) have been created to solve that problem. Now the question is, is it too good to be true?
You’ll Learn
- A Canadian Depositary Receipt (CDR) is equivalent to US stocks but is traded in CAD. It provides a currency hedge and allows fraction shares.
- CDRs have been inspired by ADRs (American Depositary Receipts), which have been around for a long time. While they may look similar, they’re a totally different product.
- CDRs’ main goal is currency hedging. Do they offer a real solution to that? Part of the answer is found in their total return versus the underlying asset.
- Another strong belief about CDRs is that they allow investors to buy shares of expensive companies at a cheaper price. While this is not entirely wrong, it’s not entirely correct either. Mike explains this by describing different-sized pizza slices of the same total pizza.
- While Canadian Depositary receipts do not have hidden fees, they are fees attached to this currency-hedged product.
- Many investors wonder if the dividend is the same. While the yield is identical, the dollar amount is obviously smaller because of the fraction of shares you get.
- Are the tax implications similar to those of regular shares? The answer is a bit foggy here…
- A CDR can have low daily trading volumes but still be liquid. Mike explains why.
- In the end, we could say that CDRs work. However, Mike doesn’t buy them. Why?
- To Mike, the Norbert Gambit process is a better solution for Canadians who want to buy US stocks.
- ETFs are also good alternatives for investors with modest funds who want to buy shares of companies like Microsoft or Costco, which trade at a couple of hundred dollars each.
- Mike ends with a summary of the advantages and disadvantages of CDRs.
Related Content
Here’s the episode about valuation, the Dividend Discount Model (DDM), yield history, PE ratio trend, value score, payout ratios, and more!
All-Time High, Should I Buy? [Podcast]
Get the steps to the Norbert Gambit process.
From CAD to USD With No Fees – A Guide to Norbert’s Gambit
Subscribe
The Best Dividends to Your Inbox!
Download our Dividend Rock Star List now and do not miss out on the good stuff! Receive our Portfolio Workbook and weekly emails, including our latest podcast episode!
Follow Mike, The Dividend Guy, on:
- YouTube
Have Ideas?
If you have ideas for guests, topics for The Dividend Guy Blog podcast, or simply to say hello, then shoot me an email.
This podcast episode has been provided by Dividend Stocks Rock.
![]()
The post CDRs, Are They Really Worth It? [Podcast] appeared first on The Dividend Guy Blog.
Can ETFs and Stocks Coexist in a Portfolio?
April 11, 2024
Can ETFs and stocks coexist in a portfolio and make that portfolio better? ETF or index ETF investing versus do-it-yourself dividend growth investing is always a big debate. You know I favor stock investing, but I keep an open mind. There is room for ETFs even if you invest in stocks.
I see both ETF investing and dividend growth stock investing strategies work very well. Should you put both in your portfolio? It depends. Let’s elaborate.
So yes, I see situations in which combining individual stocks with an ETF, or several ETFs makes a lot of sense.
Listen to Mike’s podcast.
Adding different asset types to your portfolio
Combining ETFs with some dividend growth stocks works well if you want to have several types of assets, exposure to several markets, and not have to spend too much time building that up and monitoring it.
You could start with an all-in-one ETF that has exposure to fixed income, maybe to some basic materials stocks, international markets, and the U.S. market. Use this to build your core portfolio without too much effort. Perhaps 50% of your portfolio is that ETF or split between two ETFs that don’t overlap. Your ETF is rebalanced automatically and gives you exposure to the markets and other types of assets like bonds or preferred shares that you want.

Then you add a few stocks that you like that you want to follow regularly, maybe a dozen stocks to complete the portfolio. This could work very well because you are well-diversified; a very smart way to build a portfolio.
It’s like cooking; you have your basic recipe and then add a few spices on the side, your special ingredients that make the soup even better. Start with an ETF that holds many ingredients and add a few dividend growth stocks as special ingredients.
Adding exposure to specific markets or sectors
It’s also logical to combine ETFs and stocks in the opposite situation, one in which you have a well-diversified portfolio of stocks—perhaps about 30 stocks—but you want exposure to a specific market or a specific sector.
You could use ETFs to invest in emerging markets for maybe 5 or 10% of your portfolio. Investing in emerging dividend growth stocks can be quite difficult. Adding an ETF tracking emerging markets does the job.
You could also add an ETF to get exposure to a sector or industry, artificial intelligence for stocks, or the whole information technology sector for example. If you don’t know how to choose individual stocks in this sector, or you’re concerned about their current high valuation and P/E ratios, adding an ETF can work well. It completes your portfolio adding more diversification without having to spend a lot of time and energy trying to understand a sector you’re not comfortable with. See our post about sectors and industries to learn more.
Remember investing has a lot to do with having confidence in your strategy to not worry when the market goes down. The best way to have confidence is to make sure that you understand what you own and why you own it.
Get great stock ideas in our Rock Stars list, updated monthly!
Two ways to make ETF and stocks work well together in your portfolio are having a core ETF portfolio and adding some stocks you like and want to monitor, or having a portfolio of stocks and selecting specific assets or specific sectors you want to have exposure to and go with ETF.
However, there are scenarios where combining stocks and ETFs in your portfolio is a bad thing.
Beware of duplication
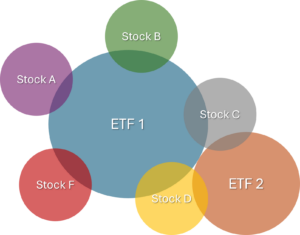
A common investing mistake is having an overlap between ETFs and the stocks in a portfolio. For example, you invest in an ETF tracking the Canadian market. Then you add Canadian stocks for banks, pipelines, telcos, and utilities. A lot of these stocks are included in your ETF, so you’re just adding more of the same.
The problem with that is that you don’t know your complete exposure to each individual stock that you own because you also have some through the ETF. You could end up with 10% of your portfolio in TD Bank without even knowing it or wanting it. Combining an index ETF with individual stocks in the same market requires a bit more work to avoid overlap between them; look at the top ten or 20 holdings of ETF you have, to ensure you don’t buy those individual stocks.
Just like cooking: adding coarse salt, sea salt, and Himalayan salt won’t make your dish better, just saltier. Add too much, and it’s inedible.
Get great stock ideas in our Rock Stars list, updated monthly!
Don’t over-diversify
More and more often becomes…too much!The second mistake is going on a shopping frenzy. Let’s say you bought a bunch of ETFs because you love to go from one idea to another or because they all just look so good! Then, you add stocks over and over again. You’ll end up with too many holdings in your portfolio.
Having 40 stocks plus 10 ETFs doesn’t make your portfolio better. You lose yourself in your diversification and strategy because you have so many different things. Several of your holdings, especially stocks, will be less than 2% of your portfolio; they don’t add much value to your portfolio returns; if they double in price, you won’t even notice.

Combining a bunch of ETFs with a bunch of stocks is over-diversification or “diworsification”, making your portfolio worse. You’ll spend so much time and energy monitoring everything in your portfolio without necessarily getting any added value. You might suffer from paralysis by analysis as too much information to track and analyze leads to doubt. Most importantly, key information can fall through the cracks. As an investor you’re responsible for your portfolio, you must know what’s going on. Losing track is bad.
The takeaway
ETFs and stocks coexisting living together in a portfolio is a good idea if you’re able to build a core portfolio of ETFs and add some stocks that aren’t duplicates. Buying ETFs also works to add exposure to specific asset types, sectors, or markets you aren’t exposed.
Having duplicate holdings is a problem, as is over-diversification. Having 60 lines in your statements is not good. It leads to doubt, paralysis by analysis, and loss of control over your investments.
The post Can ETFs and Stocks Coexist in a Portfolio? appeared first on The Dividend Guy Blog.
© Copyright 2013 Adividend