Stocks Sold: A Look Back at Mike’s Trades [Podcast]
April 03, 2024
best tips for selling stocks, blog, buy and sell, buy and sell process, Dividend Guy Trades, how to sell stocks, Investing Strategy, Mike Heroux Trades, Podcast, should I sell andrew peller stock, should I sell CAE, should I sell DIS, should I sell GNTX, should I sell MMM, when to buy and sell, when to trade stock
0 Comment
Subscribe
There are three main good reasons to sell. How has Mike’s buy-and-sell process served him so far? Was he right to sell Disney (DIS), McDonald’s (MCD), Andrew Peller (AW.UN.TO), or Algonquin (AQN)? Here’s a look at these and more of Mike’s trades and what investors can learn from them.
Download the Dividend Rock Star List and Pick among the Best Assets Only!
You’ll Learn
- Before we dive into the companies, Mike reminds us of the main reasons for selling your shares: investment thesis & dividend triangle, dividend cut, and trimming.
- Mike used to be a big fan of Disney (DIS). In 2020, it suspended its dividend due to the pandemic, shutting down its principal business activities. After three years of waiting for a dividend, Mike sold his assets at the end of 2023. However, Disney has now reinstated a small dividend payment. Does he still believe his decision was the best?
- The pandemic also greatly impacted CAE, leading the company to suspend its dividend. Again, Mike sold his shares in late 2023 since they no longer fit his investment thesis. A couple of months later, how does he look back at this trade, and what are his current thoughts about CAE?
- Mike waved goodbye to Andrew Peller (AW.UN.TO) some years ago because of significant changes in its business model. How is the company doing now? Was it a good move to sell?
- Mike sold Algonquin (AQN) about a year ago. Still, he keeps getting asked about its potential recovery. So Vero asked a different question this time. With AQN as an example, what would make him interested in looking back at a company he sold?
- Despite its dividend king title, 3M doesn’t show the same glow it used to have. How does Mike look back at it?
- Mike sold his shares of McDonald’s (MCD) a while back. Does he consider his decision a mistake?
- The last is a company that Mike likes. However, he still sold his shares. Why did he buy Gentex (GNTX), and what made him sell it?
- Mike ends by sharing his best tips for selling and never looking back.
Related Content
In March, we shared 4 Tools to Buy and Sell with No regrets. Catch them up!
4 Tools to Buy and Sell With No Regrets [Podcast]
How do you know when to cash in on your winners? A stock is up 20%-50%-75%. Will it keep going up? Is it about to crash? You feel you should sell, but you like that stock…
When to Cash in on Your Winners
Subscribe
The Best Dividends to Your Inbox!
Download our Dividend Rock Star List now and do not miss out on the good stuff! Receive our Portfolio Workbook and weekly emails, including our latest podcast episode!
Follow Mike, The Dividend Guy, on:
- YouTube
Have Ideas?
If you have ideas for guests, topics for The Dividend Guy Blog podcast, or simply to say hello, then shoot me an email.
This podcast episode has been provided by Dividend Stocks Rock.
![]()
The post Stocks Sold: A Look Back at Mike’s Trades [Podcast] appeared first on The Dividend Guy Blog.
When to Cash in on Your Winners
March 28, 2024
All investors share a goal. Making profit. How do you know when to cash in on your winners? A stock is up 20%-50%-75%. Will it keep going up? Is it about to crash? You feel you should sell, but you like that stock… Selling winners isn’t easy.
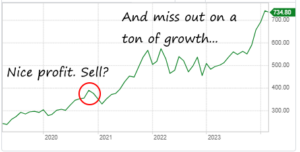
Some put a limit on the stock price gain, for example, when they’re up 50% they sell the position. As a dividend growth investor, I choose stocks I want to keep for a long time, not for a quick buck. When you hold on to solid holdings for a long time, you can get to triple-digit growth—much more interesting than 50% isn’t it? Patience can generate a lot more return than selling triggered by a cap on value appreciation.
That said, there are appropriate moments to cash in on your winners. Below, I’ll explain what I do to decide whether to sell, or trim, my winners.
Never miss a thing! Subscribe to our newsletter here.
Why sell?
I have two main reasons to sell a winning position or trim it of a few shares. The first is when my motives for buying the stock aren’t valid anymore. In other words, things have changed for the company and my thesis for investing in it in the first place is no longer true.
The other reason relates to portfolio management. When a position becomes too large, i.e., it’s overweight, my portfolio isn’t perfectly balanced, and my exposure to risk increases. Let’s look at these in detail.
Stock no longer fits my investment thesis

Every quarter, I review all holdings in my portfolio to see how they’re evolving with their most recent quarterly results. For each stock, I verify whether my investment thesis is still valid.
The investment thesis is the narrative, the story that explains why I bought the stock in the first place. It explains what I found compelling about the company and why I’d want to hold its stock forever (or 10 or 20 years).
For example, what made me confident and liked about Alimentation Couche-Tard (ATD.TO) is that: it was constantly growing by acquiring other convenience stores around the world, and also innovated to grow organically, for example, by selling fresh produce, coming up with new promotions, digital transactions, loyalty programs, etc.
During my review, I’ll see if this story changes. If ATD stops acquiring other companies or runs out of ideas for organic growth, I’ll flag it and I might eventually sell.
Backing it up with the numbers
During my review, I look beyond the narrative. Numbers. I review the dividend triangle to see the company’s trends for revenue, earnings, and dividend growth.

When the investment thesis no longer applies, looking at the triangle can confirm my suspicion that the stock isn’t as appealing as it once was. If I see revenue and earnings growth slowing down, dividend growth will likely slow down too, eventually. The company is not the company I bought originally.
I’m not trigger-happy. I don’t sell immediately following one poor quarter. However, if it’s one bad quarter after another, and my thesis isn’t right anymore, it’s time to sell and cash in my profit. Sticking to a quarterly review gives me great odds of being able to spot the issues and sell while the stock price is still high, making a nice profit.
Overweight sectors or positions
Should you cash in on your winners that still match my investment thesis and show good growth trends, as is the case with ATD.TO?
I like to let such winners run, but I might trim them if it’s needed. You see, my quarterly ritual includes reviewing my portfolio sector allocation and stock weight.
Am I overweight in a sector? If so, I could suffer a lot if a crisis happens in this sector. Remember tech stocks in 2000? I will trim winning positions in an overweight sector to rebalance the portfolio.
Overweight positions

How can you tell you’re overweight on a single holding? That depends on two factors: how many stocks you want in your portfolio, and how much you are willing to lose on a single bad investment.
If you want 40 stocks, having equal-weighted positions means each stock should occupy 2.5% of your portfolio (100/40). If it’s 30 stocks, then each one would occupy 3.33% of your portfolio. You might let your favorite stocks exceed that maximum weight at 4% or more, with others occupying less than 3.33%.
As stock prices fluctuate, your stocks’ weight changes. Some winners can exceed the maximum weight by a lot. You can trim such positions right away by selling enough shares to get their weight back to where you want it.
But I love this overweight stock…

We get attached to our winners; I know. If your investment thesis for the company is still valid and the numbers back up your feelings, ask yourself how much you’re willing to lose on a single bad investment. Is it $5K, $10K, or $20K? You come up with this arbitrary amount based on your situation and risk tolerance. Let’s say it’s $20K and your portfolio is worth $800K; you’d be okay with losing (20/800*100) = 2.5% of your portfolio on a single bad investment
The worst that happens on the market is a ~50% crash of its value. We saw this when the tech bubble burst in 2000 and during the 2008 financial crisis. With that in mind, look at your overweight position: if it drops 50% in value tomorrow, is that loss lower or higher than 2.5% of your portfolio? If it’s more, time for a diet! Trim that position, even if you love the stock.
Knowing that the worst market loss is ~50%, and you’re okay losing 2.5% of your portfolio value, your maximum weight per stock is 5%. Trim any position that exceeds 5% to rebalance your portfolio and reduce risk.
Overweight winners are usually stocks that have performed well and gained value. Trimming them by selling a few shares lets you cash in on your winners while staying invested in the company to benefit from its future growth.
Liked what you read? Don’t miss anything. Subscribe to our newsletter here.
In retirement
If you are retired, you might have to cash in on your winners by selling a few shares to supplement your income. Perhaps your dividend income isn’t enough, inflation outpaced dividend growth in your portfolio, a holding cut its dividend, or extra expenses came up. Whatever the reason, these guidelines can help you choose which stocks to sell, how much to sell, and feel good about it.
The post When to Cash in on Your Winners appeared first on The Dividend Guy Blog.
All-Time High, Should I Buy? [Podcast]
March 27, 2024
Subscribe
Buying at all-time high is frightening for a lot of investors as a mistake becomes costly! Considering the current markets high prices; should you wait or should you buy? How to determine which stocks are worth a spot in your portfolio? Let’s talk about valuation, Dividend Discount Model (DDM), yield history, PE ratio trend, value score, payout ratios and more!
Subscribe to our newsletter to receive our best downloads, which include Top Stocks, Stock Lists, and the Workbook.
You’ll Learn
- We can’t do this episode without talking about valuation. To Mike, it is closer to fortune telling than science. Why is it so?
- Some tools become handy to know if a company deserves your money or not. One of them is the Dividend Discount Model (DDM), which assess the value of the future dividend payment. Mike summarizes its pros and cons (more details in video below).
- The yield history is also a good indicator of a stock valuation as it should be stable. However, context must be added.
- The PE Ratio trend also gives investors an idea of where the current price stands compared to the average.
- At Dividend Stocks Rock, we also use the Refinitiv Value Score. What is it made of and how useful is it?
- It seems like a lot of stocks are at their all-time high. Does it mean there is a higher risk of a correction?
- The answer to the question “Should I Buy at All-Time High”, is again, it depends! What does it depend on?
- To identify companies that will thrive, Mike first starts with the dividend triangle, which is positive Revenue, EPS and dividend growth.
- Why is dividend growth so important and how is it related to a high valuation?
- How do the payout ratio and cash payout ratio play a role in buying at all-time high?
- Mike ends with examples of companies at their all-time high that he would still buy in a heartbeat: Costco (COST), Home Depot (HD), and more!
Related Content
Let’s check out the Dividend Discount Model (DDM) usefullness and advantages, flaws and limitations!
We recently held an entire webinar around the topic of all-time high market. You can watch the free replay below.
Subscribe
The Best Dividends to Your Inbox!
Download our Dividend Rock Star List now and do not miss out on the good stuff! Receive our Portfolio Workbook and weekly emails, including our latest podcast episode!
Follow Mike, The Dividend Guy, on:
- YouTube
Have Ideas?
If you have ideas for guests, topics for The Dividend Guy Blog podcast, or simply to say hello, then shoot me an email.
This podcast episode has been provided by Dividend Stocks Rock.
![]()
The post All-Time High, Should I Buy? [Podcast] appeared first on The Dividend Guy Blog.
4 Steps to Reduce Risk in a Near All-Time-High Market
March 21, 2024
all-time-high market: four steps to reduce risk, blog, market high: four steps to reduce risk, Portfolio Building, portfolio prep for next market crash or correction, portfolio: reduce your risks in near all-time-high market, Retirement, risk: reducing when market near all-time-high, Site Introduction
Four steps to reduce risk in your portfolio ahead of whatever happens next, and to keep investing confidently even with the current high market. Yes, the market is high, almost the highest in the last 34 years except during the tech bubble in 2000.
The Shiller CAPE ratio compares market earnings over time. It shows that the overall market is trading at nearly 31 times earnings. In other words, the entire market’s P/E ratio is 31. That’s expensive, and rattles a lot of investors.
Never miss anything! Subscribe to our weekly newsletter here.
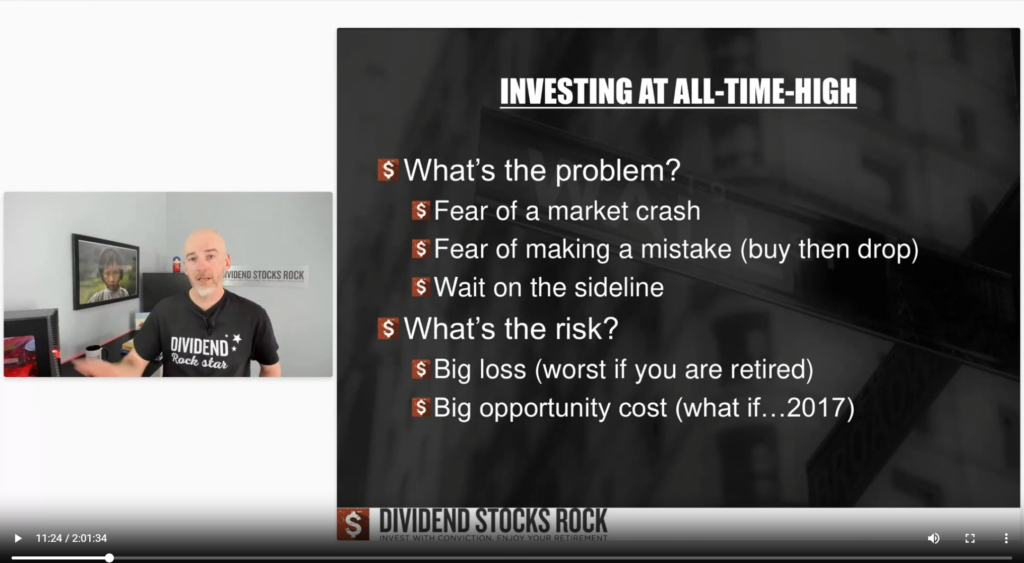
What do we fear?
We fear what could happen next. A market correction around 10% isn’t that bad; it doesn’t take too long to bounce back. Market crashes, sharp drops of 20% or more, are more serious.
 Retirees and those near retirement worry about suffering a big loss. Those still investing money are afraid of investing just before a crash happens, and often wait on the sidelines.
Recognize yourself? Luckily, there are things you can do to ensure your portfolio is ready to weather the storm and to keep investing with confidence. After all, none of us know if, when, or by how much the market will crash; holding on to your money rather than investing it could cost you. Here are four steps to reduce risk and anxiety.
1 – Beyond the stock price…
You might be wondering whether some of your holdings are overpriced and at risk of crashing along with the market. You might also hesitate to invest more and paying too much. While some stocks are overpriced, others aren’t despite their high prices. If a company increases its earnings year-over-year, it’s normal that its stock price increases also.
The graph below shows the variation in the price-to-earning (P/E) ratio for Alimentation Couche-Tard (ATD.TO) and Microsoft (MSFT) over the last 10 years.
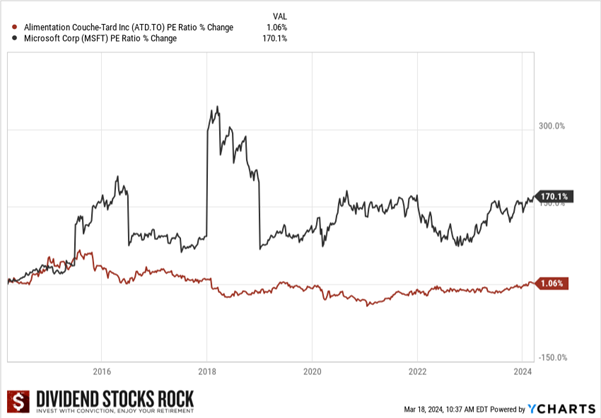
Over that period, ATD.TO’s price has gone from $14 to $80, but its P/E ratio has been pretty stable. In short, as the share price was rising, so were the earnings. To buy shares today, we’d pay almost the same multiple of ATD’s earnings as ten years ago. We can’t just look at the price to determine if a stock is overvalued.
Clarify valuation with these comparisons
What I do is compare the 5-year average P/E ratio against the Fwd P/E ratio, and the 5-year average dividend yield against the Fwd yield. For ATD.TO:
Average P/E ratio = 16.7 slightly below Fwd P/E = 18.15.
We’re paying a bit more now than the 5-year average, but not much when considering the stock’s 22.4% annualized dividend growth over five years, low payout ratio, etc.
Average yield = 0.9% slightly higher Fwd yield = 0.7%,
This also indicates a small premium on the current stock price, but again, not much.
In the graph, we see that Microsoft’s P/E ratio grew 170% over 10 years. Overpriced? Not so fast. Due to cloud computing and AI, the market expects MSFT’s growth to continue and is willing to pay a premium for the stock. Of course, the market could be wrong. If MSFT fails to continue growing at its current pace, its stock price could easily drop 10%.
Comparing MSFT’s Fwd P/E ratio and Fwd yield with their respective 5-yr average shows results similar to ATD’s—a slight increase in valuation vs. five years ago. The bulk of the 170% P/E ratio increase was driven by a high valuation in the five years of that period when MSFT wasn’t yet benefiting from cloud computing and AI.
A Fwd P/E ratio much higher than the 5-year average, and a Fwd yield much lower than the 5-year average, can indicate an overpriced stock, or not. In such a scenario, I’d try to find out why the market is valuing the stock so high.
Never miss anything! Subscribe to our weekly newsletter here.
2 – Measure your exposure to risk
Having a suitable exposure to risk is essential to protect your nest egg. That means diversifying across sectors and having appropriate weight for individual stocks.
Sector allocation
Ensure you have holdings in several sectors and not too much of your portfolio in a single sector. Having 45% invested in a single sector overexposes you to the risks the sector faces. If that sector crashes, 45% of your portfolio will drop.
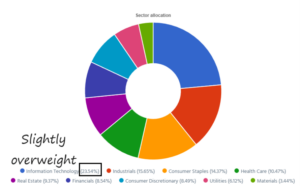 I usually limit my exposure to a single sector to 20% for my favorite sectors and up to 10% for other sectors. Retired or nearly retired investors might tailor their sector allocation to favor stable and income-producing sectors while keeping a smaller portion of their money in growth sectors.
See How Sectors and Industries Guide Investors.
Stock weight
How much are you willing to lose on a single stock in your portfolio…2%, 3%, 5% of your portfolio’s value?
Once you’ve answered that, look at your largest positions and their weight in your portfolio. During the worst market crashes in the last 40+ years, the market lost roughly 50% of its value before stabilizing and beginning to recover.
For example, let’s say you can tolerate a loss of 5% of your portfolio. If you have a $1M portfolio, you’re okay with losing $50,000 on a single stock. If that loss is from a 50% crash, the maximum amount for this position is $100,000.
If you have a holding worth over $100,000, it’s time to trim that holding. Sell some shares to decrease your exposure and reallocate the funds elsewhere to spread your risk.
3 – Focus on quality
Ensure your holdings are quality stocks. It’s alright to hold on to quality stocks even if a market crash drags them down tomorrow. They’ll bounce back faster than poor-quality holdings and reward you.
A quality holding shows:
 A very strong dividend triangle, with a consistent growth trend for revenues, earnings, and dividends.
- An investment thesis that explains how the company will be able to keep increasing its revenue and earnings over the next 5, 10, or 20 years, e.g., growth vectors, sticky business models, predictable cash flow, etc.
When you’re worried about a crash, it’s not the time to take wild guesses on holdings you’re unsure of. If you’re keeping stocks hoping that they’ll bounce back, but you don’t have a clear investment thesis for them, consider getting rid of them, or at least some of them.
4 – Dividend safety first
In a market crisis, many companies cut their dividend. Assess the dividend safety of your holdings and ensure your dividend income is diversified.
 To assess dividend safety:
- Look for low to moderate payout ratios that indicate the companies make more profit than what they pay out in dividends. See Using Payout Ratios Wisely.
- Look for a trend of dividend growth over several years.
When you see a high yield, no dividend growth or slowing dividend growth, a high payout ratio, and a weak dividend triangle, you can expect a dividend cut.
Diversification of your dividend income across several holdings makes it less painful if one of your holdings cuts its dividend. Ensure you don’t depend on one or two companies for 25% of your dividend income, especially if you’re retired or near retirement.
Make sure your dividend income comes from companies in different sectors or industries. In other words, don’t invest in 10 REITs, or 6 Canadian banks; throw in some utilities, consumer staples, telcos, etc.
Using these four steps to reduce risk will help you sleep well at night, whatever happens on the market.
Waiting on the sidelines?
You have money to invest but you’re waiting for the “imminent” market crash?
We never know when a market crash will happen and when it does happen, we don’t know when we’ve hit rock bottom. You could end up waiting a long time, all the while missing out on dividend payments.
If you’re worried about investing at peak prices the day before the worst crash in a decade, plan to invest at intervals, e.g., monthly, quarterly, to minimize that risk. Learn more about this in How to invest lump sum. Using these four steps to reduce risk and also to invest new money wisely, at any time!
The post 4 Steps to Reduce Risk in a Near All-Time-High Market appeared first on The Dividend Guy Blog.
Weak Dividend Triangle = Sell? [Podcast]
March 20, 2024
Subscribe
It’s easy to understand a positive dividend triangle, but how to explain a weak one? This episode was inspired by a webinar attendee who asked what to do with a Dividend Triangle showing a negative EPS. Should you sell on downward trends, red flags, and suspicious numbers? Let’s find answers!
Don’t Miss Tomorrow’s Webinar on Investing at All-Time High Market! Click to Save Your Spot!
You’ll Learn
- We can’t start this episode without a reminder of what is the dividend triangle, which is positive 5-year revenue, EPS, and dividend growth.
- Mike explains how he uses the Dividend Triangle as a first set of filters to select dividend growers.
- However, there are times when a good company may show a weaker dividend triangle and this is what we’ll look at today. First, what should we do if one metric goes down?
- Revenue can fluctuate from a quarter to another. How should investors analyse it?
- Vero asks the question that inspired this episode. What does a negative EPS growth mean on the dividend triangle?
- Some companies show a negative EPS growth but remain strong. It is the case for Brookfield Corporation (BN) and TD Bank (TD).
- What does it mean when dividend growth slows down? Is this a sell sign?
- The payout ratio is another metric that can help assess the dividend growth health. Mike explains how using the right one will add analysis context for investors.
- In the end, when does a weak triangle become a sell sign? In short, you need to be able why numbers are going down…
- Would Mike buy a stock with a weak dividend triangle? Is this a buying opportunity?
Related Content
Mike shared the bear case of Brookfield Corporation (BN) on The Moose on the Loose podcast.
Investors’ main struggle remains how or when to buy and sell. Here are four tools (and a bonus!) to do it without regrets!
4 Tools to Buy and Sell With No Regrets [Podcast]
More details about the Dividend Triangle are included in the article below.
Detect Losers and Find Winners with The Dividend Triangle
Quick Note on the Upcoming Webinar
On Thursday, March 21st, I’ll be hosting a free webinar on positioning your portfolio in an all-time-high market.
After this webinar, you should be able to:
After this webinar, you should be able to:
- Make the difference between price anchoring and sound valuation.
- Fight your fear of investing now and losing money.
- Get the deal you are looking for.
- Buy dividend stocks in an overvalued market without getting burned.
Here are the complete details:
- The webinar is on Thursday, March 21st at 1pm ET.
- It is 100% free, no strings attached.
- The presentation is about 50 minutes.
- I’ll stay for one hour to answer all your questions.
- I’ll provide the handouts to all live attendees.
- A free replay link will be sent to all registered attendees.
Prepare your questions. This webinar is about 50 minutes long, and I will answer all your questions about stocks, strategies, and the economy afterward.
Save Your Spot to Our Next Webinar on Investing at All-Time High Market!
The Best Dividends to Your Inbox!
Download our Dividend Rock Star List now and do not miss out on the good stuff! Receive our Portfolio Workbook and weekly emails, including our latest podcast episode!
Follow Mike, The Dividend Guy, on:
- YouTube
Have Ideas?
If you have ideas for guests, topics for The Dividend Guy Blog podcast, or simply to say hello, then shoot me an email.
This podcast episode has been provided by Dividend Stocks Rock.
![]()
The post Weak Dividend Triangle = Sell? [Podcast] appeared first on The Dividend Guy Blog.
© Copyright 2013 Adividend