Weak Dividend Triangle = Sell? [Podcast]
March 20, 2024
blog, dividend triangle, how to analyze stocks, Investing Strategy, negative EPS, Podcast, sell signs, stocks with downward trends, weak dividend triangle, weak dividned growth, weak earnings per share, weak revenues
0 Comment
Subscribe
It’s easy to understand a positive dividend triangle, but how to explain a weak one? This episode was inspired by a webinar attendee who asked what to do with a Dividend Triangle showing a negative EPS. Should you sell on downward trends, red flags, and suspicious numbers? Let’s find answers!
Don’t Miss Tomorrow’s Webinar on Investing at All-Time High Market! Click to Save Your Spot!
You’ll Learn
- We can’t start this episode without a reminder of what is the dividend triangle, which is positive 5-year revenue, EPS, and dividend growth.
- Mike explains how he uses the Dividend Triangle as a first set of filters to select dividend growers.
- However, there are times when a good company may show a weaker dividend triangle and this is what we’ll look at today. First, what should we do if one metric goes down?
- Revenue can fluctuate from a quarter to another. How should investors analyse it?
- Vero asks the question that inspired this episode. What does a negative EPS growth mean on the dividend triangle?
- Some companies show a negative EPS growth but remain strong. It is the case for Brookfield Corporation (BN) and TD Bank (TD).
- What does it mean when dividend growth slows down? Is this a sell sign?
- The payout ratio is another metric that can help assess the dividend growth health. Mike explains how using the right one will add analysis context for investors.
- In the end, when does a weak triangle become a sell sign? In short, you need to be able why numbers are going down…
- Would Mike buy a stock with a weak dividend triangle? Is this a buying opportunity?
Related Content
Mike shared the bear case of Brookfield Corporation (BN) on The Moose on the Loose podcast.
Investors’ main struggle remains how or when to buy and sell. Here are four tools (and a bonus!) to do it without regrets!
4 Tools to Buy and Sell With No Regrets [Podcast]
More details about the Dividend Triangle are included in the article below.
Detect Losers and Find Winners with The Dividend Triangle
Quick Note on the Upcoming Webinar
On Thursday, March 21st, I’ll be hosting a free webinar on positioning your portfolio in an all-time-high market.
After this webinar, you should be able to:
After this webinar, you should be able to:
- Make the difference between price anchoring and sound valuation.
- Fight your fear of investing now and losing money.
- Get the deal you are looking for.
- Buy dividend stocks in an overvalued market without getting burned.
Here are the complete details:
- The webinar is on Thursday, March 21st at 1pm ET.
- It is 100% free, no strings attached.
- The presentation is about 50 minutes.
- I’ll stay for one hour to answer all your questions.
- I’ll provide the handouts to all live attendees.
- A free replay link will be sent to all registered attendees.
Prepare your questions. This webinar is about 50 minutes long, and I will answer all your questions about stocks, strategies, and the economy afterward.
Save Your Spot to Our Next Webinar on Investing at All-Time High Market!
The Best Dividends to Your Inbox!
Download our Dividend Rock Star List now and do not miss out on the good stuff! Receive our Portfolio Workbook and weekly emails, including our latest podcast episode!
Follow Mike, The Dividend Guy, on:
- YouTube
Have Ideas?
If you have ideas for guests, topics for The Dividend Guy Blog podcast, or simply to say hello, then shoot me an email.
This podcast episode has been provided by Dividend Stocks Rock.
![]()
The post Weak Dividend Triangle = Sell? [Podcast] appeared first on The Dividend Guy Blog.
Markets Performance Review – February Dividend Income Report
March 14, 2024

In September of 2017, I received slightly over $100K from my former employer, representing the commuted value of my pension plan. I decided to invest 100% of this money in dividend growth stocks.
Each month, I publish my results on those investments. I don’t do this to brag. I do this to show my readers that it is possible to build a lasting portfolio during all market conditions. Some months we might appear to underperform, but you must trust the process over the long term to evaluate our performance more accurately.
Quick Note on the Upcoming Webinar
On Thursday, March 21st, I’ll be hosting a free webinar on positioning your portfolio in an all-time-high market.
After this webinar, you should be able to:
After this webinar, you should be able to:
- Make the difference between price anchoring and sound valuation.
- Fight your fear of investing now and losing money.
- Get the deal you are looking for.
- Buy dividend stocks in an overvalued market without getting burned.
Here are the complete details:
- The webinar is on Thursday, March 21st at 1pm ET.
- It is 100% free, no strings attached.
- The presentation is about 50 minutes.
- I’ll stay for one hour to answer all your questions.
- I’ll provide the handouts to all live attendees.
- A free replay link will be sent to all registered attendees.
Prepare your questions. This webinar is about 50 minutes long, and I will answer all your questions about stocks, strategies, and the economy afterward.
Save Your Spot to Our Next Webinar on Investing at All-Time High Market!
Performance in Review
Let’s start with the numbers as of March 1st 2024 (during the day):
Original amount invested in September 2017 (no additional capital added): $108,760.02.
- Portfolio value: $249,809.27
- Dividends paid: $4,530.76 (TTM)
- Average yield: 1.81%
- 2023 performance: +20.69%
- SPY= +26.19%, XIU.TO = +11.87%
- Dividend growth: +1.7%
Total return since inception (Sep 2017 – March 2024): 129.69%
Annualized return (since September 2017 – 78 months): 13.65%
SPDR® S&P 500 ETF Trust (SPY) annualized return (since Sept 2017): 13.60% (total return 129.100%)
iShares S&P/TSX 60 ETF (XIU.TO) annualized return (since Sept 2017): 9.15% (total return 76.63%)
Markets Performance Review
From time to time, I use my portfolio update to do a quick market review of both the U.S. and Canadian stock market’s performance.
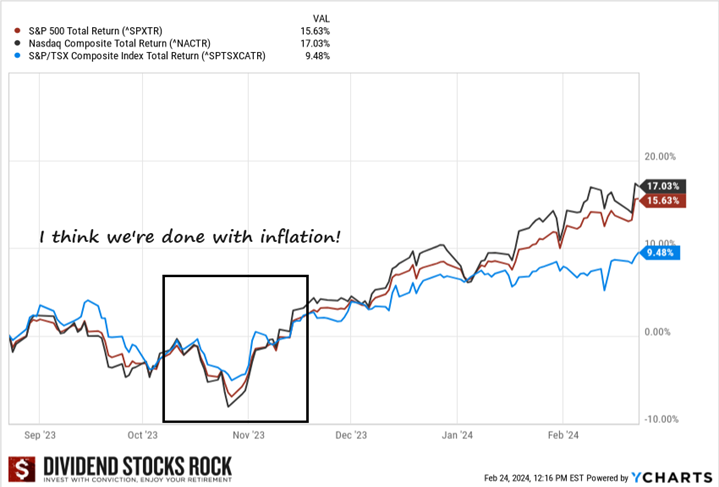
I discussed the inflation and interest rate themes at length in 2023. While it’s impossible to know how this story will end (smooth landing or recession?), I’ve often stated that once investors believe we are finished with inflation and done with interest rate hikes, we will see the markets resume their upward movement.
We got the first hints towards the end of October 2023. Since then, the market has been pushing higher and higher while we haven’t yet seen the first interest rate cut. Ironically, it seems that Wall Street and Bay Street expect a lot more from the FED and the Bank of Canada than what’s on the central banks’ play book for 2024.
My guess? The market and its followers will be disappointed as the months go by this year.
Are Markets Overvalued?
This brings us to the eternal question: “are markets overvalued?”. After all, we don’t expect a major earnings surge in 2024 as many companies will deal with an economic slowdown. Many retailers and transportation companies have raised red flags toward the end of 2023 and are not that optimistic for 2024.
When we look at the S&P 500 Shiller CAPE ratio, we are “in line” with what we have seen since 2017. However, please keep in mind that in 2017 the market was trading at an all-time high and many thought the market was overvalued back then.
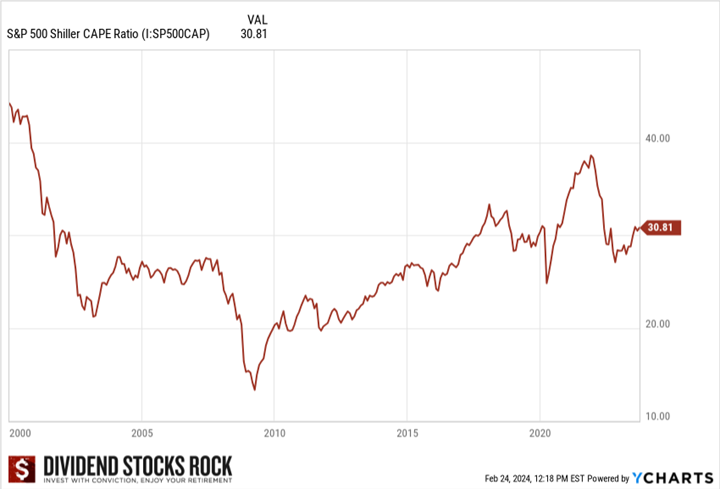
The Shiller CAPE ratio is calculated by dividing the current market price of the S&P 500 index by the average of the last 10 years of earnings, adjusted for inflation. This adjustment for inflation allows for a more accurate comparison of earnings over time ensuring that the ratio reflects real changes in valuation, and not just changes in the price levels.
31 times earnings seem expensive. Correction; it is expensive!
Does it mean you should sell everything and wait for a market crash? Ah! Imagine if you had done that in 2017…
I prefer to focus on quality companies that will continue to increase their dividends over time. It’s easier to apply and it generates better returns. In the meantime, what I read is high expectations from investors.
- Investors expect interest rate cuts and hope it will drive economic growth.
- They also expect a lot from artificial intelligence (more growth, more profit, and also ways to help “older” companies to cut down their operation costs).
As you know, the stock market is a voting machine. Right now, all votes are for growth. If it doesn’t happen, then you can expect a correction in the best-case scenario (market down around 10%) or a bear market (down by more than 20%) if we don’t get enough rate cuts.
Again, the focus on dividend growers appears to be one of the best approaches to achieving my financial goals.
U.S. Market Review
I’ve discussed with many DSR members the relevance of selecting specific holdings while you can simply invest in the S&P 500 and get amazing results. Let’s be honest: it’s incredibly difficult to beat the S&P 500. As of late, it has gotten even harder to beat it. Why?
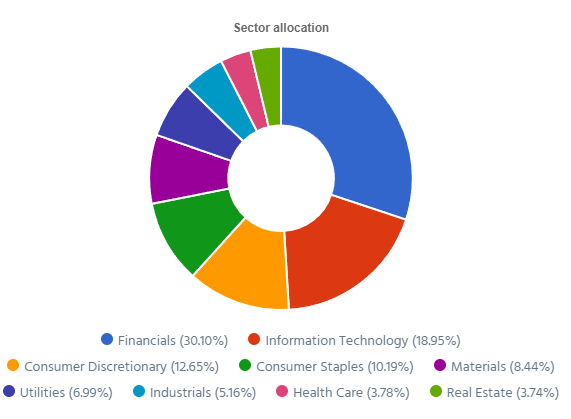
Because most of the S&P 500 return is driven by the Magnificent Seven. This is a small group of tech stocks driving the entire index to whole new levels. They are able to affect significantly the performance of the entire market as they move higher quickly and represent 29% of the index (as of February 23rd 2024):
- Apple (AAPL): 6.30%
- Microsoft (MSFT): 7.15%
- NVIDIA (NVDA): 4.53%
- Amazon (AMZN): 3.71%
- Alphabet (GOOGL, GOOG): 1.99% + 1.69% = 3.68%
- Meta (META): 2.52%
- Tesla (TSLA): 1.28%
On one hand, those companies drove exceptional results. Not having them in your portfolio makes it very difficult to beat the S&P 500 performance.
On the other hand, concentration in technology-related companies is a high risk. If they fail to perform, your retirement could be at risk.
What’s the solution? The efficiency and magic of diversification!
You are wrong if you think that matching or beating the market should be your objective. You should focus on how much return you need constantly to achieve your financial goals.
Chasing returns will force you to jump from one strategy to another. To always chase the strategy that generated the best return… last year, over the last 3 years or the last 5 years. How can you know that this is the strategy that will do well going forward?
As a quick example, you can see how the Energy sector isn’t the solution for growth anymore (but it was for two consecutive years!).
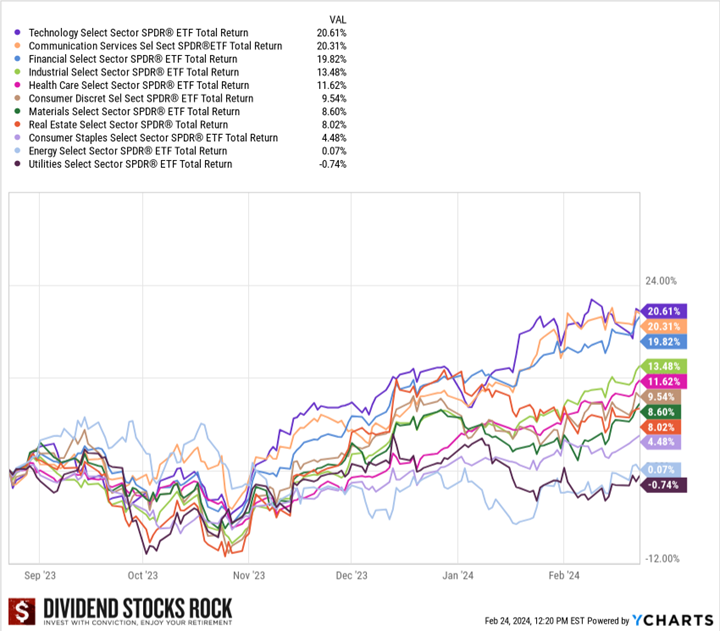
The U.S. market has been driven by tech stocks and most companies in the communication services pushing this sector ETF through the roof are companies like Alphabet and Meta. Another sector doing well is the financial sector. It makes sense as asset managers did benefit from a strong market in 2023 (if the market goes up, assets under management follow and so do the fees paid to asset managers). Banks should do better as interest rate revenues will continue to be stable and we have better chances of avoiding a recession if we start cutting rates pre-emptively.
What’s New in Maply Syrup Country?
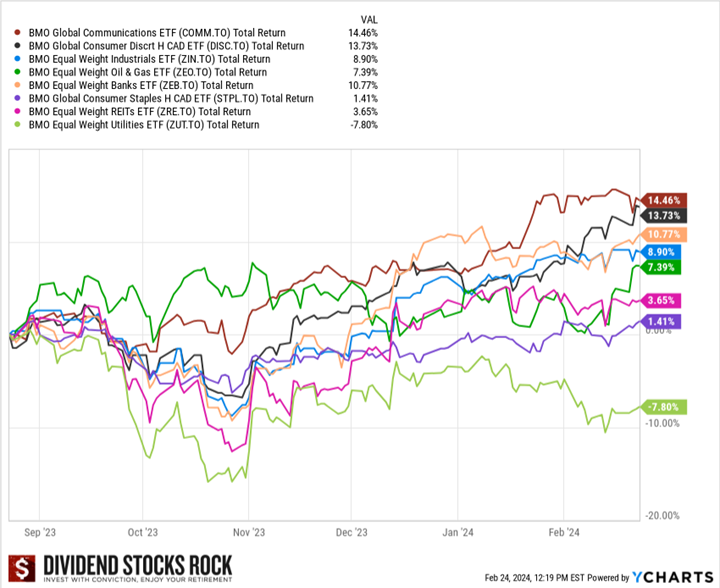
Utilities continue to suffer as the interest rates are not their friend and renewable energy utilities can’t seem to get any love from the market. Consumer staples are sobering up and maybe investors have realized that while grocery stores are great foundation stocks for a sleep-well-at-night portfolio, their growth potential is limited due to heavy competition.
Inflation seems to be under control as it slowly but surely gets closer to the magical target of 2%. This means banks should have a break and could hope for better days in 2025. In the meantime, it’s obvious that the economy is slowing down. We have seen many companies (notably Canadian Tire, Canadian Pacific and Canadian National Railway) explaining that their results have been affected negatively by weaker consumer spending.
While the U.S. market seems overpriced, the Canadian market hasn’t surged as high. There might be more opportunities up north for the time being. However, this doesn’t mean buying all high yielding stocks thinking they will recover magically. Keep in mind there is a reason why Scotiabank offers about 2.5% more yield than National Bank.
While I’m building my Smith Manoeuvre portfolio, I find it difficult to select companies offering a yield above 4% coming from various industries. I’m even starting to think that I’ll lower my overall yield by adding a few more low-yield, high-growth positions in 2024. The goal will be to improve total return, benefit from the leverage impact and also to select companies that are in a better position to face a potential recession.
Smith Manoeuvre Update
Slowly but surely, the portfolio is taking shape with 10 companies spread across 7 sectors. My goal is to build a portfolio generating 4-5% in yield across 15 positions. I will continue to add new stock monthly until I reach that goal. My current yield is 5.05%.
Adding more of Exchange Income (EIF.TO)
Exchange Income reported a solid quarter with revenue up 21% and EPS up 12%. Revenue in the Aerospace & Aviation segment increased by $45 million or 13% while revenue in the Manufacturing segment increased by $68 million or 34%. This growth was partially attributed to strategic acquisitions and continued investment in operating subsidiaries, demonstrating the success of EIC’s strategy to nurture and invest in acquired companies with excellent management teams. IN 2023, EIF made substantial growth capital investments, particularly in the Aerospace and Aviation segment which should drive growth in 2024 and beyond.
Here’s my SM portfolio as of March 1st, 2024 (during the day):
| Company Name | Ticker | Sector | Market Value |
| Brookfield Infrastructure | BIPC.TO | Utilities | $907.40 |
| Canadian National Resources | CNQ.TO | Energy | $1,080.42 |
| Capital Power | CPX.TO | Utilities | $578.85 |
| Canadian Tire | CTA.A.TO | Consumer Disc. | $966.70 |
| Exchange Income | EIF.TO | Industrials | $1,555.20 |
| Great-West Lifeco | GWO.TO | Financials | $714.85 |
| National Bank | NA.TO | Financials | $641.76 |
| Nutrien | NTR.TO | Materials | $935.35 |
| Telus | T.TO | Communications | $903.64 |
| TD Bank | TD.TO | Financials | $1,139.60 |
| Cash (Margin) | -$32.48 | ||
| Total | $9,358.81 | ||
| Amount borrowed | -$9,000.00 |
Let’s look at my CDN portfolio. Numbers are as of March 1st, 2024 (during the day):
Canadian Portfolio (CAD)
| Company Name | Ticker | Sector | Market Value |
| Alimentation Couche-Tard | ATD.B.TO | Cons. Staples | $25,172.81 |
| Brookfield Renewable | BEPC.TO | Utilities | $8,446.92 |
| CCL Industries | CCL.B.TO | Materials | $9,830.80 |
| Fortis | FTS.TO | Utilities | $8,922.78 |
| Granite REIT | GRT.UN.TO | Real Estate | $9,433.60 |
| Magna International | MG.TO | Cons. Discre. | $5,146.40 |
| National Bank | NA.TO | Financials | $12,934.90 |
| Royal Bank | RY.TO | Financial | $8,615.75 |
| Stella Jones | SJ.TO | Materials | 10,698.88 |
| Cash | $561.62 | ||
| Total | $99,764.46 |
My account shows a variation of +$1,172.26 (+1.19%) since the last income report on February 5th.
Many companies reported their earnings in February, let’s have a look!
Brookfield Renewable keeps growing
Brookfield Renewable reported a solid quarter with FFO per unit growth of 9% for the quarter and +7% for the year. Management also announced a 5% dividend increase! The results reflect the benefit of BEP’s diverse asset base, high-quality inflation-linked and contracted cash flows, organic growth, and contributions from acquisitions. In 2023, BEP secured contracts for new developments for almost 50 terawatt hours, 90% is with corporate customers. BEP keeps growing as it deployed (or agreed to deploy) $9B in capital last year into new projects.
CCL Industries surged!
CCL Industries reported a solid quarter with revenue up 5%, EPS up 17% and a dividend increase of 9%. The stock surged by more than 15% on earnings day! Revenue growth was supported by a mix of organic growth and acquisitions. CCL Segment sales were up 8.9%, Avery +1%, Checkpoint +9.7%, but at Innovia (which is under a restructuring) sales were down 18.6%. The Company finished the year with a strong balance sheet and excellent liquidity despite investing $345.8 million on eight acquisitions, buying back shares and paying a nice dividend.
Fortis is boring but that’s okay
Fortis reported an okay quarter with revenue down 9% and flat adjusted EPS. Adjusted Net Earnings was unfavorably impacted by the timing of adjustments associated with the disposition of Aitken Creek ($0.05). Excluding this adjustment, the increase in Adjusted Net Earnings for the fourth quarter was due mainly to rate base growth from higher retail revenue in Arizona. The Corporation’s 2024-2028 capital plan totals $25 billion, $2.7 billion higher than the previous five-year plan. The increase is driven by organic growth, reflecting regional transmission projects for several business segments.
Granite REIT shows a safe distribution
Granite REIT reported another solid quarter as revenue increased by 3% and AFFO per unit increased by 10%. The payout ratio for the quarter was 70% and 71% for the full year of 2023. Granite’s growth was driven by the completion of developments and expansions beginning in the fourth quarter of 2022, contractual rent adjustments and consumer price index-based increases and renewal leasing activity. For 2024, management expects AFFO per unit to grow by 3% to 7%. With a payout ratio at 71%, this leaves plenty of room for another distribution increase while still allocating capital for additional projects.
Magna International shows improvements
Magna International reported a solid quarter with revenue up 9% and EPS up 46%. The company’s revenue growth was ahead of the 7% growth for global light vehicle production. In addition to higher global vehicle production, sales benefitted from the launch of new programs and acquisitions net of divestitures. Earnings were fueled by an ongoing focus on cost controls initiated last year. The company also announced a 3.2% dividend increase. It’s not much, but it reflects prudent capital allocation. Looking ahead, the company sees 2024 sales of $43.8B to $45.4B vs. $44.9B consensus and adjusted net income of $1.6B to $1.8B.
National Bank remains the best of the big 6
National reported a good quarter all things considered. Revenue was up 5% and EPS was up 2%. Results were driven by higher interest income but partially offset by higher PCLs (from $1.17B to $1.26B, or +8%). By segment: P&C: net income +4%, slowed down by higher PCL (from $511M to $539M or +5%). Wealth Management -1%; revenue was up from higher fees on assets and strong market performance. However, the segment income was hurt by higher expenses. Financial markets +3%, driven by higher revenue from global markets and corporate and investment banking services. US & Intl: +2%, mostly driven by ABA bank performance. PCLs rose $1M for this quarter.
Royal Bank didn’t impress, but didn’t disappoint
Royal Bank reported declining adjusted EPS of -6%. Results were affected by a higher tax rate (we mentioned it was temporary last year), higher PCLs (from $532M to $813M or +53%). By segment: P&C -3%, driven by higher volume of deposits (+9%) and loans (+5%), more than offset by higher PCLs. Wealth Management: -27%, affected by the cost of the FDIC special assessment in the U.S. (including City National) and higher expenses. Insurance went from $67M to $220M driven by higher insurance investment and different actuarial assumptions. Capital Markets -7%, was driven by lower revenue and higher PCLs.
I did a complete of Q1-2024 for the Canadian Banks in this video below.
Stella Jones boosts its dividend!
Stella-Jones reported a good quarter as revenue increased by 3.5%, but EPS jumped by 61%. Management also announced a dividend increase of 22%! Pressure-treated wood sales rose $22 million, or 4%, driven by the 8% organic sales growth of the Company’s infrastructure businesses, namely utility poles, railway ties and industrial products. Higher pricing for utility poles (sales +13%) and railway ties (+2%) was partially offset by lower volumes and a decrease in residential lumber sales (sales were down 18%). Industrial products (only 4% of SJ’s sales) were also down 15.6% due to the timing of projects related to railway bridges and crossings.
Here’s my US portfolio now. Numbers are as of January 9th, 2024:
U.S. Portfolio (USD)
| Company Name | Ticker | Sector | Market Value |
| Apple | AAPL | Inf. Technology | $7,111.40 |
| Automatic Data Processing | ADP | Industrials | $9,476.82 |
| BlackRock | BLK | Financials | $11,314.80 |
| Brookfield Corp. | BN | Financials | $14,224.21 |
| Home Depot | HD | Cons. Discret. | $11,510.65 |
| LeMaitre Vascular | LMAT | Healthcare | $6,730.00 |
| Microsoft | MSFT | Inf. Technology | $19,394.89 |
| Starbucks | SBUX | Cons. Discret. | $7,944.10 |
| Texas Instruments | TXN | Inf. Technology | $8,491.50 |
| Visa | V | Financials | $14,132.50 |
| Cash | $370.63 | ||
| Total | $110,701.50 |
My account shows a variation of +$3,460.44 (+3.23%) since the last income report on February 5th.
There were lots of companies reporting earnings over the past 30 days. Let’s review what they did!
Brookfield Corp is buying shares
Brookfield reported a solid quarter with adjusted distributable EPS up 17%. You must look at the adjusted results as it includes the special distribution of 25% of its asset management business (Brookfield Assets Management into BAM) in December 2022. The company also announced a 14% dividend increase! Brookfield’s private fund strategies continue to attract strong interest from its clients leading to $93B of capital raised which, combined with the approximately $50B anticipated upon the closing of American Equity Life (“AEL”), brings the total to $143B. Management also expects to buy back $1B in shares in 2024.
Home Depot feels the economic slowdown
It was a disappointing quarter for Home Depot as revenue declined by 3% and EPS fell by 15%. Comparable sales decreased 3.5% during the quarter vs. -3.6% consensus. Customer transactions were down 1.7% during the quarter to $372.0M. The average ticket of customers was 1.3% lower to $88.87 for the quarter. Management also expects comparable sales to decline by 1% in 2024. The home improvement retailer expects to open approximately 12 new stores this year. At least, HD increased its dividend by 7.7% as management is optimistic for the long-term perspective of home renovation and construction. This is just going to be a bad year for HD.
LeMaitre Vascular surged on a good quarter
LeMaitre Vascular reported a solid quarter with revenue up 19%, EPS up 52% and management announced a dividend increase of 14%! Growth was driven by geographical expansion and product sales, with significant growth in EMEA, the Americas, and APAC. LMAT plans to increase its sales force and has made regulatory strides, including Artegraft CE filings and expansions in Asia. The guidance for 2024 anticipates continued growth, leveraging operational efficiencies and an improved gross margin. They are projecting a 10% sales growth and a gross margin of 68%.
Here’s the complete stock analysis of LMAT.
Microsoft integrated Activision Blizzard with success
Microsoft reported a solid quarter with revenue up 18% and EPS up 26%. Revenue in Productivity and Business Processes was up 13%, driven by Office Commercial products and Dynamics. Intelligent Cloud was up 20%, driven by Azure (+30%). Please note that Azure’s growth has been slowing down for a few quarters in a row now. More Personal Computing was up 19%, driven by the acquisition of Activision Blizzard and, surprisingly, by Windows revenue (+9%). Going forward, Microsoft has the intention of integrating AI functions at scale across its products. This should open the doors for more growth.
My Entire Portfolio Updated for Q4 2023
Each quarter we run an exclusive report for Dividend Stocks Rock (DSR) members who subscribe to our very special additional service called DSR PRO. The PRO report includes a summary of each company’s earnings report for the period. We have been doing this for an entire year now and I wanted to share my own DSR PRO report for this portfolio. You can download the full PDF showing all the information about all my holdings. Results have been updated as of January 10th, 2024.
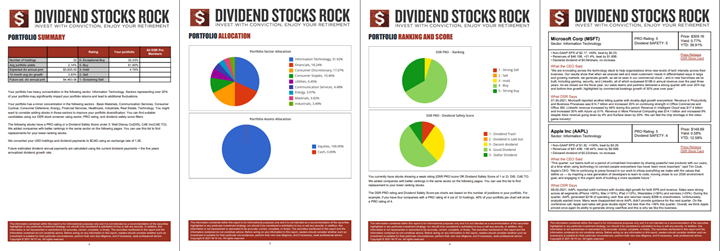
Download my portfolio Q4 2023 report.
Dividend Income: $419.95 CAD (+5% vs February 2023)
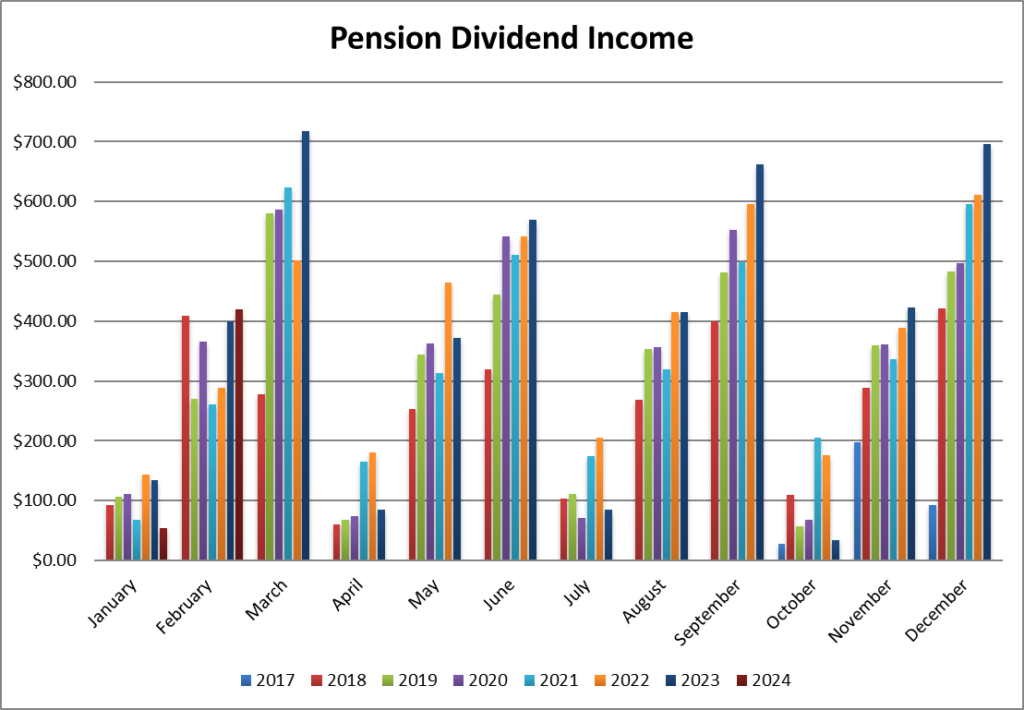
This was a good month for dividends, my best one for the month of February. The dividend growth was driven by Canadian banks (National bank and Royal) and all companies show a higher dividend payment than last year. I sold some shares of Apple at the end of 2023 which partially offset my dividend income for this month.
Dividend growth (over the past 12 months):
- Granite: +3.13%
- Royal Bank: +13.26%
- National Bank: +9.28%
- Starbucks: +7.55%
- Apple: -44.35% (I sold shares of AAPL)
- Texas Instruments: +4.84%
- Currency: -0.006%
Canadian Holding payouts: $253.17 CAD.
- Granite: $35.21
- Royal Bank: $89.70
- National Bank: $128.26
U.S. Holding payouts: $123.05 USD.
- Starbucks: $48.45
- Apple: $9.60
- Texas Instruments: $65.00
Total payouts: $419.95 CAD.
*I used a USD/CAD conversion rate of 1.3554
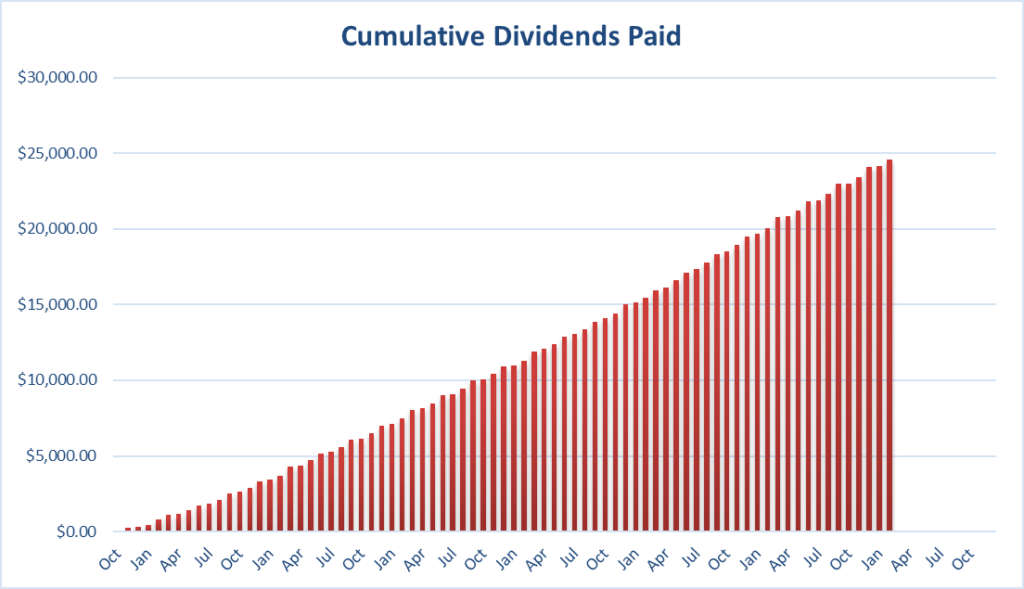
Since I started this portfolio in September 2017, I have received a total of $24,586.88 CAD in dividends. Keep in mind that this is a “pure dividend growth portfolio” as no capital can be added to this account other than retained and/or reinvested dividends. Therefore, all dividend growth is coming from the stocks and not from any additional capital being added to the account.
Final Thoughts
Save Your Spot to Our Next Webinar on Investing at All-Time High Market!
On Thursday, March 21st, I’ll be hosting a free webinar on positioning your portfolio in an all-time-high market.
After this webinar, you should be able to:
After this webinar, you should be able to:
- Make the difference between price anchoring and sound valuation.
- Fight your fear of investing now and losing money.
- Get the deal you are looking for.
- Buy dividend stocks in an overvalued market without getting burned.
Here are the complete details:
- The webinar is on Thursday, March 21st at 1pm ET.
- It is 100% free, no strings attached.
- The presentation is about 50 minutes.
- I’ll stay for one hour to answer all your questions.
- I’ll provide the handouts to all live attendees.
- A free replay link will be sent to all registered attendees.
Prepare your questions. This webinar is about 50 minutes long, and I will answer all your questions about stocks, strategies, and the economy afterward.
Going forward, being cautiously optimistic should be the new buzzword. I must admit: seeing the overall market valuation at such levels makes me think twice about my next move. However, I follow a strict process where I sell my winners when they become too big. This process enables me to take profits when they are juicy and reallocate the proceeds toward better diversification.
I will never sell to go cash, but I’m thinking about trimming more aggressively some positions as the year advances. I have entertained this possibility, but I’m not ready to pull the trigger yet. As you are aware of my process, I like to take mental note and reflect on them for a few months or often until the end of the year. I don’t make rash decisions with my portfolio and it has served me well so far.
Cheers,
Mike.
The post Markets Performance Review – February Dividend Income Report appeared first on The Dividend Guy Blog.
4 Tools to Buy and Sell With No Regrets [Podcast]
March 13, 2024
blog, buy and sell, buy and sell stocks, how to buy and sell, how to buy and sell stocks, how to know when to buy a stock, how to know when to buy and sell stocks, Investing Strategy, Podcast, portfolio dashboard, stock comparison tool, stock screener, what to look for when investing in stocks, when to buy stocks, when to sell stocks
Subscribe
You’re not alone. Among the thousands of investors we talk with yearly, the main struggle remains how or when to buy and sell. So today, we’ll share four tools (and a bonus!) to do it without regrets!
Subscribe to our newsletter to receive our best downloads, which include Top Stocks, Stock Lists, and the Workbook.
You’ll Learn
- While we’ll use some Dividend Stocks Rock tools, investors can find free alternatives or build their own. Mike did exactly this when creating his membership website.
- A stock screener is the first tool that can ease your buy-and-sell struggle. What should a good stock screener be made of?
- How do you use the Stock Screener to buy stocks? Mike likes to first keep it broad and then narrow it down.
- On the other hand, the stock screener is really helpful in finding replacements for the stocks you hesitate to sell.
- Another tool that can bring excitement when stock picking is a comparison tool. When metrics are disclosed side by side, it’s easy to decide. We even did a whole episode, which you can retrieve here.
- It’s important to remember that a stock comparison tool works best for stocks in the same sector or industry.
- How would investors use it to help their selling decision? It’s actually the ideal tool to clean up your portfolio!
- A portfolio dashboard can help you quickly identify your strengths and weaknesses by providing a clear and concise image. Mike explains how it helps investors.
- Mike believes that the visual component, projection metrics, and easy navigation are key features of a portfolio dashboard.
- How does it prevent investors from falling into analysis paralysis? Well, it shows within minutes if you respect your own rules…
- The fourth tool is probably the easiest to find for free: it’s about reading quarterly earnings reports or calls. What type of info can we find in them?
- Following quarterly earnings validates your thesis, gives you a better understanding of the company, and allows you to take mental notes.
- Mike often talks about how the narrative has to match the numbers and vice versa. What does he mean exactly?
- There’s one more tool we wanted to add as an extra, and it is AI! Artificial intelligence can help investors get quick outlines of earnings or can define acronyms and financial terms.
Subscribe to our newsletter to receive our best downloads, which include Top Stocks, Stock Lists, and the Workbook.
Related Content
Catch up on the Subsectors Series!
- Pipelines and Utilities
- Grocery Stores and Restaurants
- Telecoms and Semiconductors
- Military & Aerospace and Banks
Detect losers and find winners with the dividend triangle. Mike invented this concept. Here’s an explanation.
Detect Losers and Find Winners with The Dividend Triangle
Your portfolio allocation explains your returns and its strengths and weaknesses. Don’t overlook it; make it perfect!
Cracking the Code: The Ideal Portfolio Allocation [Podcast]
Subscribe
The Best Dividends to Your Inbox!
Download our Dividend Rock Star List now and do not miss out on the good stuff! Receive our Portfolio Workbook and weekly emails, including our latest podcast episode!
Follow Mike, The Dividend Guy, on:
- YouTube
Have Ideas?
If you have ideas for guests, topics for The Dividend Guy Blog podcast, or simply to say hello, then shoot me an email.
This podcast episode has been provided by Dividend Stocks Rock.
![]()
The post 4 Tools to Buy and Sell With No Regrets [Podcast] appeared first on The Dividend Guy Blog.
Understanding the Financial Services Sector
March 07, 2024
The Financial Services sector is both exciting and scary for dividend investors. On one hand, you have solid banks that are the heart of our capitalist system; a sign of trust, stability, and growth. On the other hand, think about all the exotic financial strategies like mortgage-backed securities, options, and swaps. Even those who manufacture such products don’t always understand the complexity of the monsters they create.
Get in-depth information about all sectors Recession-proof portfolio workbook. Download it now!
To simplify things, we divide financials into three groups:
- Asset managers: companies that are managing/investing money for others. Mutual funds, hedge funds, real asset managers, and ETF managers are part of this group. Asset managers usually perform in step with the overall market. It is very rare to see an asset manager’s stock price increase during a bear market.
- Banks: you can subdivide them into global and regional banks, and consider investment banking, commercial banking, and credit as distinct banking industries. It’s all down to deposits and loans. Banks like higher interest rates because the spread between rates on loans and those on deposits increases to their advantage.
- Insurance: includes life, property & casualty, reinsurance, specialty, and brokers. Insurance companies need strong asset management skills to align their revenues with potential claims costs. It’s easier for them to manage their assets when interest rates are high.
Greatest strengths
Financials represent a true investing opportunity for dividend investors. Many strong asset managers, Canadian banks, and insurance companies share their wealth with shareholders. Just remember to not invest in one that you don’t fully understand.
Asset managers
With asset managers, for example, it’s important to grasp their business and the differences between the two types of asset managers: asset-light and asset-heavy.
- Asset-light managers, such as Brookfield Asset Management (BAM/BAM.TO), manage funds coming from other investors and pension plans and devise strategies. They have few assets of their own. They charge fees based on total assets under management (AUM).
- Asset-heavy managers like Brookfield Corporation (BN/BN.TO) do the asset-light manager’s job (strategy + earning fees on AUM), and also contribute with their own assets. Therefore, they benefit directly from their strategies, selling those assets later for a profit. They recycle assets, selling those that are at an excellent value and reallocating the funds to undervalued assets. The classic “buy low, sell high”.
They usually perform very well during bull markets. They enjoy a very sticky business with recurrent cash flow (fees paid by institutional investors). With the shift from mutual funds to ETFs and copious amounts of money to be made in wealth management, leaders in ETFs or financial advisory services will lead asset management going forward.
Banks
 US and Canadian banks signal where the economy is going. They increase provision for credit losses (PCLs), lowering their earnings, when they expect more consumers to default on their loans. If they’re right, there’s no surprise; you were warned, and they were ready. If they’re wrong and consumers pay their debts, they recover the PCLs, which pushes their earnings up.
The Big Six Canadian banks are unique, in their highly regulated oligopoly that’s protected by the government. They use their core business in Canada to generate significant cash flow which they use to grow internationally. It’s why they’re able to pay a yield of ~4% and still boast mid-single-digit annualized dividend growth rates over decades, except when forced to pause growing their dividends in 2020-2021 due to the pandemic, which they resumed when allowed. Reputed as conservative, they show low payout ratios (40-60% range), even when they increase their (PCLs). Expect dividend increases in 2024.
Insurance
Not a big fan of insurance companies; they depend too much on external factors (catastrophes, interest rates, etc.). It’s an industry I’d rather ignore in my portfolio to focus on my strength, i.e., my knowledge of the banking industry.
That said, high interest rates are good news for both banks and insurance companies, even more so for life insurance companies. Roughly 50%+ of banks’ income is interest. While rate hikes can push some consumers and businesses toward bankruptcy, they improve banks’ interest rate spreads, which is their margin. To ensure their solvency, insurance companies must invest a lot of the premiums they receive from customers in bonds. With higher interest rates, they generate better results from this portion of their asset allocation.
Greatest weaknesses
A bank’s largest asset is the trust of the market. Lose that, all hell breaks loose. Canadian banks were barely affected by subprime mortgages in 2008, yet they lost around 40-50% of their value. Why? Lost trust due to a big panic.
Other bad examples in 2023 were SVB Financial Group (SIVB) and First Republic Bank (FRC) both failing. Banks must keep a lot of capital on their balance sheet. Since keeping cash generates low returns, they invest it in fixed-income products such as bonds.
What happens when interest rates rise rapidly? Fixed-income products drop in value, which means that banks’ collateral loses value. If a bank isn’t capitalized properly, that’s a problem. If it urgently needs capital to meet its obligations, it might sell assets or issue shares. This often causes panic in the market, as happened with SIVB and FRC, and their stock price crashed.
Get in-depth information about all sectors Recession-proof portfolio workbook. Download it now!
Factors affecting financial services companies
![]() Interest rates and equity markets dictate if this sector does well or not. With low interest rates, banks see their spread (their margin) get thinner. Insurance companies have a similar problem. Since they invest premium payments to make money to cover future claims and generate a profit, an entire asset class (bonds) offering mediocre returns doesn’t help.
Interest rates and equity markets dictate if this sector does well or not. With low interest rates, banks see their spread (their margin) get thinner. Insurance companies have a similar problem. Since they invest premium payments to make money to cover future claims and generate a profit, an entire asset class (bonds) offering mediocre returns doesn’t help.
When the market goes sideways, many asset managers struggle. If you wonder why the market has been so volatile over the past 15 years, it’s partially due to hedge funds, options, and other “wild” trading strategies. Institutional investors shorting positions or entering massive positions through options can get into big trouble. When the market drops suddenly, fund managers get a margin call, but they don’t have enough liquidity to cover the minimum value. They’re forced to sell assets, pushing the market even lower.
Getting the best of the financial services sector
Understand your investments. Financial businesses often make money from complex strategies. If you don’t grasp how life insurance companies make money (and how they protect their premiums), move along; look for another sector or industry that you understand.
For insurance companies, focus on their underwriting process and size; the larger the company, the more data it gets from its contracts, and the easier it gets for it to manage risk for future contracts and price that risk accurately.
In a market panic, Canadian banks are likely going to get hit, but they’ll still offer you the most reliable dividends in this industry. They’ve proven their resiliency during the 2008 financial crisis, and again  throughout the pandemic. They increased PCLs during that period but remained well-capitalized. Entering 2024, PCLs have been on the rise for a while, but banks remain well capitalized and all payout ratios, except ScotiaBank, are below 50%.
Invest in leaders with diversified business models rather than one-trick ponies. Leaders enjoy unrivaled economies of scale virtually impossible to compete against. BlackRock (ETFs), JPMorgan (banking from A to Z), and T Rowe Price (retirement funds) show such competitive advantages.
Who should invest in the financial services sector? How much?
The financial services sector offers a great variety of solid dividend growers with decent yields. It’s a great fit for both income and growth investors. You can aim for 10% to 20% of your portfolio in this sector but please, don’t buy all Canadian banks; one or two will do.
The post Understanding the Financial Services Sector appeared first on The Dividend Guy Blog.
Insights into Military & Aerospace and Banks – Subsectors Series [Podcast]
March 06, 2024
BAC stock, bank industry, bank subsector, best bank stocks, Best Dividend stocks, best military stocks, blog, BMO stock, BNS stock, CAE stock, CIBC stock, EQ Bank stock, GD stock, GSY stock, JPM stock, LMT stock, military industry, military subsector, NA.TO Stock, NOC stock, NTIOF stock, OZK stock, Podcast, RTX stock, RY stock, TD stock
Subscribe
The Military & Aerospace and Banks industries are two serious ones. They both involved a lot of money. Yet, one shows excellent contenders in the US, while the other thrives better in Canada. What should investors know about these subsectors? Which companies deserve your attention? Let’s hit high altitude and finance!
Subscribe to our newsletter to receive our Get the Best of 6 Sectors issue.

You’ll Learn
- The military and aerospace subsector is part of the industrial sector, which is quite diversified with 25 industries. As it was formed by all the innovative companies as part of the industrial era, does it still show some growth?
- Large companies and barriers to entry in the military and aerospace subsector make it quite attractive for investors.
- Unfortunately, wars in Ukraine and Palestine have brought a growing interest in this subsector. Is it dependent on conflicts and political tensions to perform?
- The subsector faces challenges when inflation and interest rates rise. What else makes them less performant?
- Most companies evolve in the US. Among Mike’s favorites, we can name Lockheed Martin (LMT), Northrop Grumman (NOC), General Dynamics (GD), and RTX Corp (RTX). The podcaster explains why he likes them.
- Although it doesn’t fit the dividend growth investing strategy, CAE deserves a mention for Mike.
- Moving on to Banks. Mike starts with a few words about the Financial Services sector. What should investors know?
- Of course, banks are highly related to the economic situation. In which context do they perform well?
- Recession makes it tough for them nonetheless. Mike gives his 1 to 6 ranking and why. Lear more about Royal Bank (RY), TD Bank (TD), BMO (BMO), CIBC (CMI), ScotiaBank (BNS), and National Bank (NA.TO).
- We add a not on smaller players in Canada such as Laurentian Bank, Canadian Western Bank, GoEasy and EQ Bank. Does Mike like these stocks?
- Investors tend to believe that every Canadian Bank is a good choice. But this is a wrong assumption to make. For instance, some issues are going on with BNS…
- Now, let’s discuss Mike’s favorite US banks: JP Morgan (JPM), Bank of America (BAC), and Bank OZK (OZK). Why are they among the best?
Related Content
Catch up on the series with all the previous episodes.
- Pipelines and Utilities
- Grocery Stores and Restaurants
- Telecoms and Semiconductors
From Chips to Chatter: Telecoms and Semiconductors Landscape – Subsectors Series [Podcast]
There will be a complete video about Q1-2024 Canadian Banks earnings tomorrow. Subscribe to our channel not to miss it!
The Best Dividends to Your Inbox!
Download our Dividend Rock Star List now and do not miss out on the good stuff! Receive our Portfolio Workbook and weekly emails, including our latest podcast episode!
Follow Mike, The Dividend Guy, on:
- YouTube
Have Ideas?
If you have ideas for guests, topics for The Dividend Guy Blog podcast, or simply to say hello, then shoot me an email.
This podcast episode has been provided by Dividend Stocks Rock.
![]()
The post Insights into Military & Aerospace and Banks – Subsectors Series [Podcast] appeared first on The Dividend Guy Blog.
© Copyright 2013 Adividend