For the last episode of this series, Mike and his co-host review the REIT and the Industrial sectors. While these two sectors can seem uninteresting, they both include some well-known and solid companies that can be great adding to a dividend growth investor’s portfolio.
Get the best of REITs and Industrials; listen now!
Psst!! Scroll down a little to get the links to related videos and articles!
You’ll Learn
- Considering the pandemic and the state of the economy, are REITs buy opportunities or risky investments?
- How can debt level influence these two sectors and how an investor should manage it.
- What ratios should an investor use to analyse REITs.
- Strengths and weaknesses of the technology sector and how to get the best from it.
- Some companies cut or suspended their dividends in both sectors. How to know when to keep or to sell a stock.
- More about Mike’s favorite picks: GRT.UN.TO, CRT. UN.TO, ESS, MMM, AOS, FAST, LMT, GD, and more!
REITs Valuation Formulas
While REITs are part of a shortlist of sectors that are perfect for retirees or other income-seeking investors, it is important to understand that they cannot be analyzed using the same metrics as other sectors.
The Funds from Operations (FFO) and Adjusted Funds from Operations (AFFO) are probably the most useful tools to analyze a REIT’s financial performance. Those two metrics replace the earnings and adjusted earnings for the regular stock. While those are different, it’s all about cash flow and the REITs’ ability to sustain their dividend payments. We can find those metrics inside each REIT’s quarterly report and subsequent press release. It is important to not only follow the FFO/AFFO in total but also to follow the FFO/AFFO per unit of ownership.
- FFO = Earnings + Depreciation (Amortization) – Proceeds from Property Sales
- AFFO = Earnings + Depreciation (Amortization) – Proceeds from Property Sales – Capital Expenditures
The use of the loan to value ratio (LTV) is a great tool to analyze the REIT’s future ability to raise low-cost capital. The LTV is easy to calculate from the financial statement, as you only need 2 measures of data:
- LVT = Mortgage Amount / FMV of properties
You certainly don’t want to invest in a REIT showing a high LTV. This means that their credit rating may be at risk and the price for future debt will be higher. In other words, it could mean less money for future dividends.
The last metric you must follow that is specific for REITs is the Net Asset Value (NAV). The NAV (usually shown by units) can be translated to the equivalent of a Price to Book ratio.
- NAV = Total Property Fair Market Value – Liabilities
The idea is to compare a few REITs from your list against one another. This is how you should be able to find the ones with the best metrics. A lower than the industry NAV is either a riskier play or a value play. The AFFO and LVT will tell you which one it is.
Now, as they can be hard to memorize from the podcast, here are the industries for each sector.
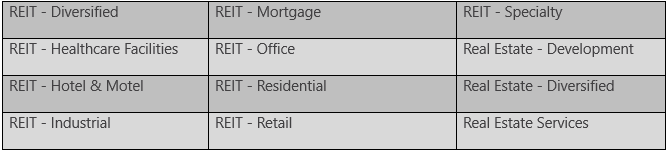
REITs Sub-Sectors (Industries)
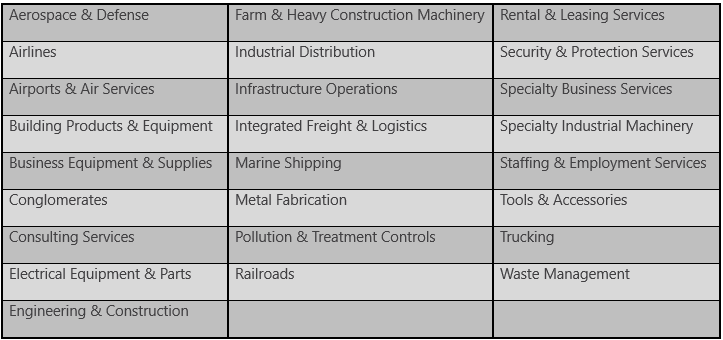
Industrials Sub-Sectors (Industries)
Related Videos and Articles
Mike’s favorite picks in the REIT sector have also been discussed in the videos below.
During the episode, we mentioned some concepts that you may not be familiar with: the Dividend Triangle, Sector Allocation, and How and When to sell losers. You can relate to the links below to get more information.
[Podcast] DGB 02: What The Hell is The Dividend Triangle?
[Podcast] DGB 08: Sector Allocation – How Many Sectors Should You Have in Your Portfolio and Which Ones?
Why You Should Follow Your Stocks Quarterly – March Dividend Income Report
The post [Podcast] DGB 11: Get the Best of Each Sector Series – REITs and Industrials appeared first on The Dividend Guy Blog.