Each month at Dividend Stocks Rock, we cover an industry and select interesting dividend growth stocks to help you managing your portfolio. I’m offering you our industry review while members have access to 15 stocks highlighted in the newsletter. Companies are selected according to my 7 investing principles.
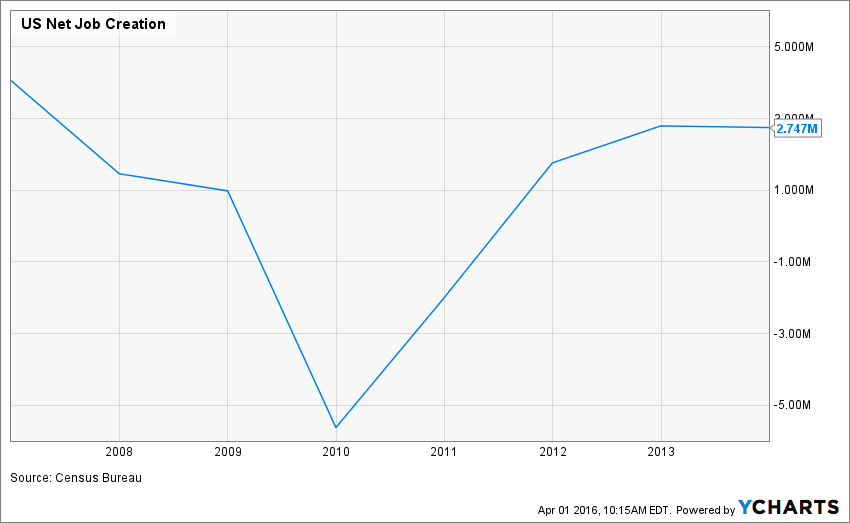
While the stock market is doing that roller coaster thing, we can look at some graphs that are showing steady trends. These graphs are all linked to the US economy at the moment. Let’s start with jobs creation:
source: Ycharts
I like to go back in time to look at what has happened historically. This graph shows us how job destruction was important after the 2008 crash. Then, we can see that starting in 2012, more jobs were created and this is a strong trend. The past 2 months (February and March) showed net job creation result over 200,000 per month. We often discuss that the current US economy was creating “McJobs” since most jobs created since 2008 is closer to the minimum wage than before. However, now that we post robust numbers month after month, I don’t really buy the McJobs theory anymore. I think we have some good jobs being created on a monthly basis.
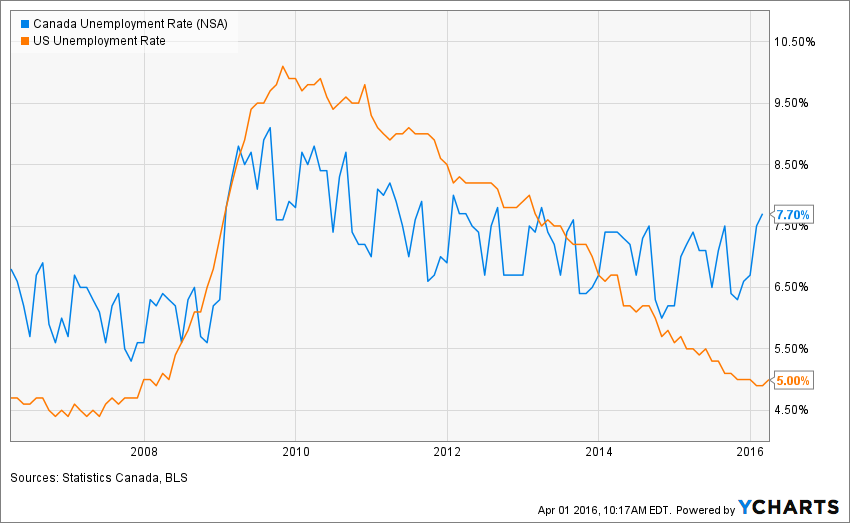
The second graph I want to show you is the unemployment graph on both sides of the border:
source: Ycharts
This graph shows you how diversified the US economy is. After reaching 10% unemployment after the crisis; all sectors have since contributed to create more and more jobs so we can now post a “near-full-employment-rate”. You may want to wait for the Black Swan to rise; the US economy is clearly not going to let it fly. Keep in mind that 71% of the US GDP is linked to the American consumer. If he has a job and feels safe about his employment status, he will contribute to the economy.
On the Canadian side, it has been more complicated with oil & other resources prices wreaking havoc making all businesses in Alberta, Saskatchewan and Newfoundland struggle. Still, the Canadian economy has shown resilience during this tougher periods with service industries picking-up where the natural resources industries have left jobs behind. This is why the unemployment rate has remained somewhat stable between 6.50% and 7.50% since 2012.
source: Ycharts
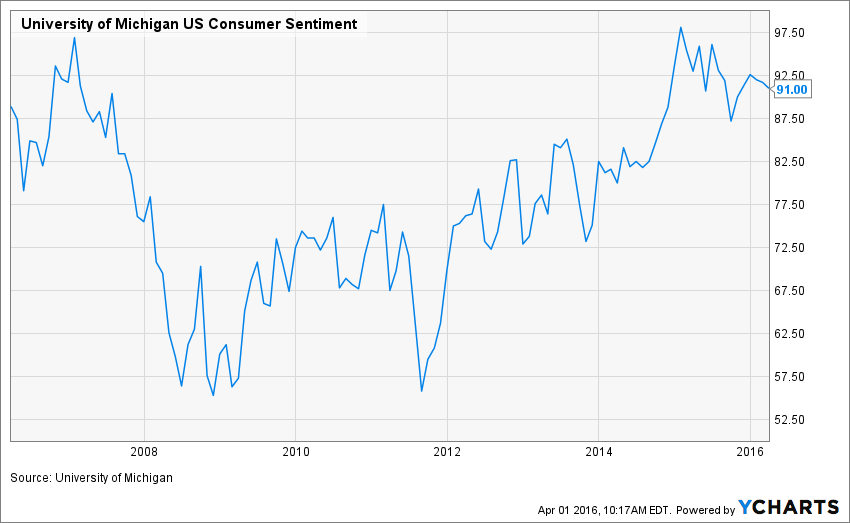
The graphic above shows the US Consumer Sentiment over the past 10 years. We can see there is a very strong uptrend since 2012. While consumers may have been frightened by China’s economic problems, a strong currency slowing exports and the oil industry cutting jobs; they still show a relatively high level of confidence.
This is not really surprising as overall working conditions are looking bright and the FED is not in a hurry to raise interest rates. This leaves more room for industries to hire and borrow at low cost while Americans can continue to benefit from the low mortgage rate environment. Low gasoline prices are also helping families to meet their budget without making serious sacrifices.
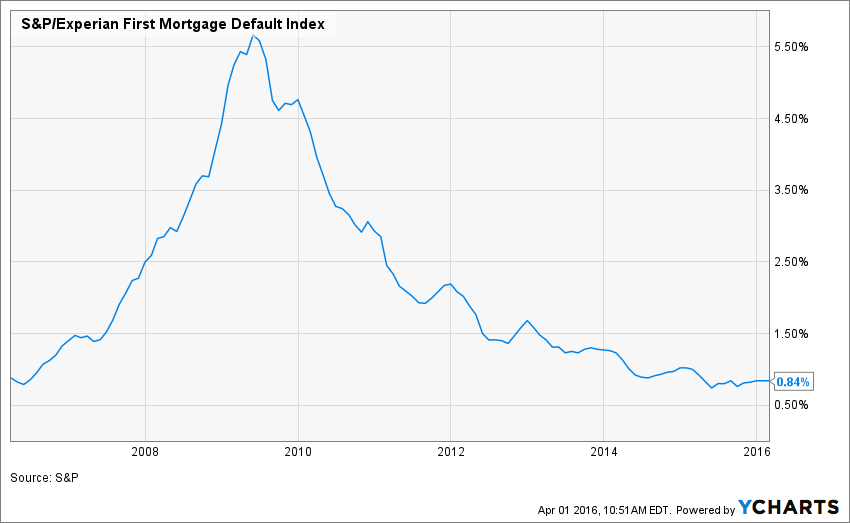
There is one last graph I want to share with you with regards to the US economy. This graph shows the default rate of first mortgages in the US:
source: ycharts
This picture speaks for itself; homeowners are paying their bills! Overall, it seems obvious to me that cyclical industries will benefit from this healthy economic environment in the US. Several companies in this sector have suffered from a good beating on the stock market due to fears revolving around the global economy. Each time there is fear, it creates buying opportunities.
What about the Canadian Economy?
Believe it or not, the Canadian economy is not doing that bad. If you are a family that was working in Fort McMurray, I can understand you don’t share the same view. However, if you look at the big picture, the low currency effect has started to help other sectors of the economy. While unemployment is still not going down, the economy is going further one step at a time. Don’t get me wrong; I’m not saying the Canada’s economy is flourishing, but it is evolving in positive territory. Considering the current world economic environment, I think it’s a pretty good achievement.
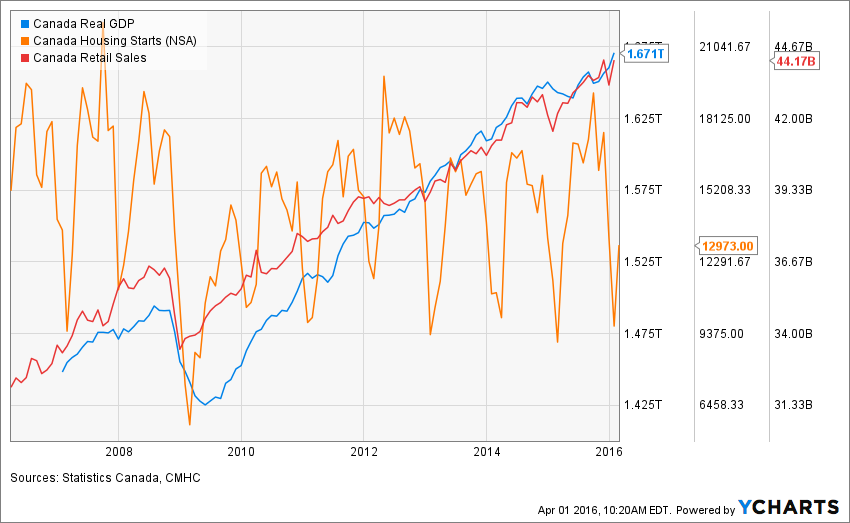
source: Ycharts
When we put data on a larger scope, we can’t even see the technical recession we had during the summer of 2015 (look at the blue line on the graph). It is just a small curve leading to a small rebound. As previously mentioned, services sector led by retail sales picked-up the lead and grew at a similar pace.
While I’m still worried about a potential housing bubble, I must admit the Canadian Government changed many property access related laws to diminish the impact of rising interest rates. Before 2008, it was possible to buy a house with 0% cash down and benefit from a mortgage of 40 years. Now, the maximum amortization for an insured mortgage is 25 years (30 for uninsured) and the minimum cash down is 5% (20% for uninsured). This is reducing the number of people buying homes with a very limited cash flow. By reducing this number, we also reduce the number of potential mortgage defaults in the event of rising interest rates.
As you can see with the orange line (Canada housing starts), this didn’t affect the new home construction industry. In fact, the numbers are fairly steady since 2012. This is another sign that the Canadian economy is showing resilience.
Finally, I think the consumer cyclical sector is definitely a great place to start looking for potential buys. There are several great companies in this sector that are worth considering.
In the Dividend Stock Rock Premium Newsletter, we have analyzed a few companies included in our table. We covered 6 CDN and 9 US dividend stocks.