
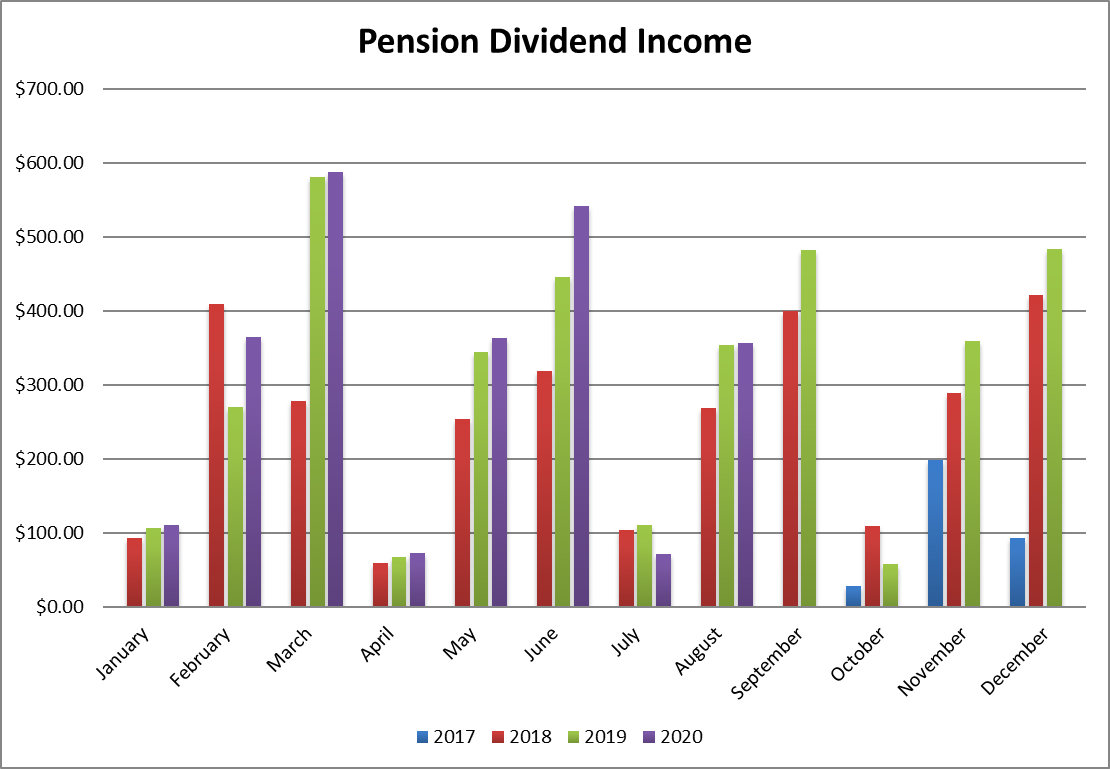
In September of 2017, I received slightly over $100K from my former employer which represented the commuted value of my pension plan. I decided to invest 100% of this money into dividend growth stocks.
Each month, I publish my results. I don’t do this to brag. I do this to show you it is possible to build a lasting portfolio during an all-time highly valued market. The market will inevitably go down… as it has lately. But I continue to enjoy cashing consistent and growing dividends despite that negative market action!

The Tech Bubble, 20 Years Later
Back in September 2000, I was thinking about which university I would go to. I didn’t even know the NASDAQ was about to collapse and take more than a decade to recover. We just got “high speed” internet at home! Companies like Microsoft (MSFT), IBM (IBM), Apple (AAPL) and Intel (INTC) were trading at high valuations. The price-earnings ratio were between 30 and 60. I’m not even talking about Amazon (AMZN) or Yahoo! whose valuations were based on thin air at that time.
The world thought “this time, it will be different”. The internet was about to open the door for decades of productivity gains and growth. That part was, and still is, true. What went wrong back then is we substituted long-term investing principles of analysis for new sets of metrics such as page views and clicks. Therefore, the NASDAQ took forever to recover because its index was filled with companies with no viable business model.
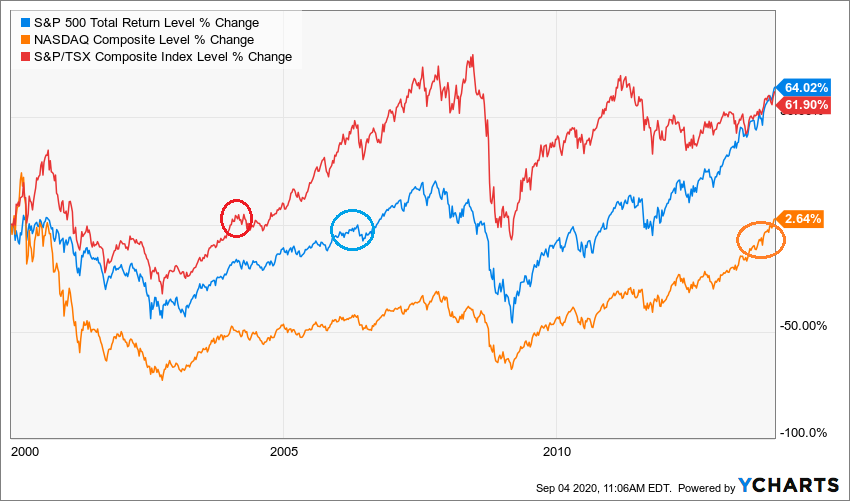
Source: Ycharts
Unless you were highly concentrated in tech stocks back then, you survived that crisis and recovered from your losses along with the rest of the S&P500 although it took about 6 years. Unfortunately, a second market crash (2008) tested your patience and forced you to wait until 2011 to see gains once again.
If you chose diversification across all of North America, you would have started to make money on the Canadian market in 2004… only 4 years after the tech bubble crash.
By the time the NASDAQ finally reached the break even point (excluding inflation), both the S&P 500 and the TSX were up by more than 60%. This is not exactly an impressive return (roughly 3.50% annualized rate over 14 years). Therefore, you must remember that the stock market rewards patient investors who are in for the long game. Here’s the same graph with results as of September 4th, 2020.
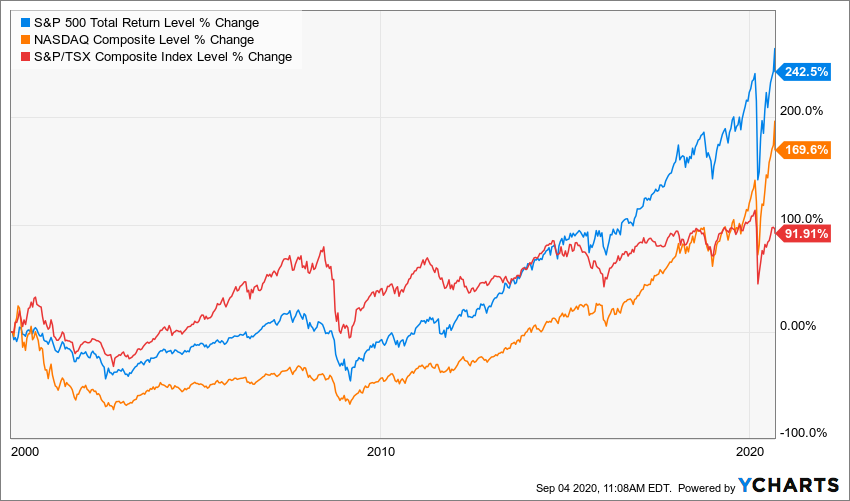
Source: Ycharts
If you look at the 20 years following the tech bubble, you will notice much volatility. What’s the end picture? The S&P500 going up by almost 250%, The NASDAQ by 170% and the Canadian market by 92%.
We would all wish we had invested all our money around 2002-2003 and just watched the market go up from there. But, investing at the peak of the tech bubble has not put your retirement plan in jeopardy if you built a portfolio exposed to many sectors.
This is the lesson of the day: take the time to make sure your portfolio will enjoy growth from the best of breed from many different sectors!
Here’s my CDN portfolio now. Numbers are as of September 4th, 2020 (before the bell):
Canadian Portfolio (CAD)
| Company Name | Ticker | Market Value |
| Alimentation Couche-Tard | ATD.B.TO | 7,853.52 |
| Andrew Peller | ADW.A.TO | 5,467.38 |
| National Bank | NA.TO | 5,807.20 |
| Royal Bank | RY.TO | 5,870.40 |
| CAE | CAE.TO | 3,950.00 |
| Enbridge | ENB.TO | 6,776.49 |
| Fortis | FTS.TO | 5,198.49 |
| Intertape Polymer | ITP.TO | 4,572.00 |
| Magna International | MG.TO | 4,537.40 |
| Sylogist | SYZ.V | 4,674.57 |
| Cash | 333.96 | |
| Total | $55,041.41 |
My account shows a variation of $1,126.01 (+2%) since the last income report on August 5th.
The start of my portfolio this month is Alimentation Couche-Tard (ATD.B.TO) with its whopping 44% earnings jump. EPS jumped by 48% which was primarily driven by strong growth in merchandise and service and in road transportation fuel gross profit, as well as by good cost controls. Due to the ongoing restrictive social measures in the various geographies in which the Corporation operates, the COVID-19 pandemic continued to have a meaningful impact on its financial results. On merchandise sales, it benefited from consolidated trips by consumers driving larger basket size purchases. While on the fuel side, as revenues declined from lower demand and lower fuel prices, it was compensated for by strong fuel margins.
Here’s my US portfolio now. Numbers are as of September 4th, 2020 (before the bell):
U.S. Portfolio (USD)
| Company Name | Ticker | Market Value |
| Apple | AAPL | 11,604.48 |
| BlackRock | BLK | 8,107.68 |
| Disney | DIS | 5,995.80 |
| Gentex | GNTX | 6,420.20 |
| Hasbro | HAS | 3,680.46 |
| Lazard | LAZ | 3,257.88 |
| Microsoft | MSFT | 13,038.00 |
| Starbucks | SBUX | 7,350.80 |
| Texas Instruments | TXN | 7,083.50 |
| United Parcel Services | UPS | 5,846.74 |
| VF Corporation | VFC | 4,112.40 |
| Visa | V | 10,448.00 |
| Cash | 221.95 | |
| Total | $87,167.89 |
The US total value account shows a variation of +$6,134.99 (+7.6%) since the last income report on August 5th.
At the time of reviewing my holdings, we are in the middle of a “tech drop”. It seems that many investors decided to cash in on their gains and my U.S. portfolio will likely be going even lower next month. In August, my tech stocks have thrived and brought my portfolio values to a record level.
My entire portfolio updated for Q2 2020
Each quarter, we run an exclusive report for Dividend Stocks Rock (DSR) members who subscribe to our very special additional service called DSR PRO. The PRO report includes a summary of each company’s earnings report for the period. We have been doing this for an entire year now and I wanted to share my own DSR PRO report for this portfolio. You can download the full PDF giving all the information about all my holdings. Results have been updated as of July 2020. The Q3 report will be available during my October update.
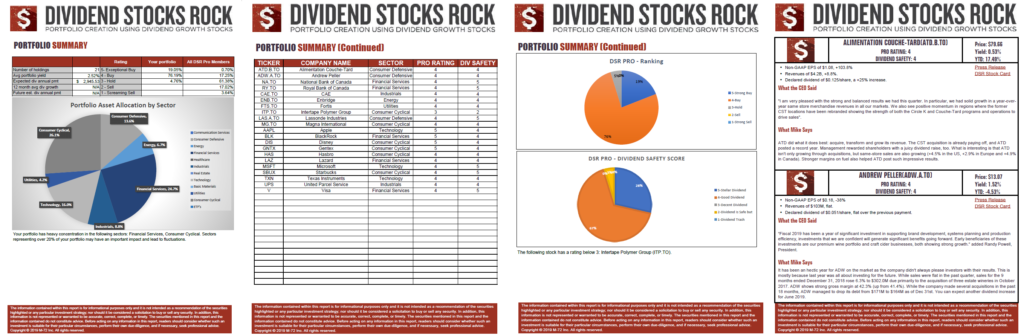
Download my portfolio Q2 2020 report.
Dividend Income: $356.16 CAD (+0.6% VS August 2019)
I didn’t receive much more money than last year. Is it because my strategy doesn’t work? Not at all. In fact, most of my holdings are showing higher dividends vs the one paid in August 2019. The lack of growth is coming primarily from two factors:
#1 Alimentation Couche-Tard’s dividend was recorded during my July 2020 update while it was recorded last year in my August 2019 update.
#2 I had to sell shares of Apple (AAPL) a few months ago to rebalance my holdings. My exposure to Apple shares was about 15% of my entire portfolio. I sold shares across all my accounts which decreased my dividend payments this month. Here’s some of the details on my dividends.
Dividend growth (over the past 12 months):
- Royal Bank: +5.88%
- National Bank: +4.41%
- Lazard: +0%
- Starbucks: +13.89%
- Hasbro: +0%
- Texas Instruments: +16.88%
- Apple: -17.55% (I sold some shares)
- *Alimentation Couche Tard was recorded in my last report)
- Currency fluctuation: -1%
Canadian Holdings payouts: $121.60 CAD
- Royal Bank: $64.80
- National Bank: $56.80
U.S. Holding payouts: $178.75 USD
- Lazard: $44.17 + $3.77
- Starbucks: $34.85
- Hasbro: $31.28
- Texas Instruments: $45.00
- Apple: $19.68
Total payouts: $356.16 CAD
*I used a USD/CAD conversion rate of 1.3122
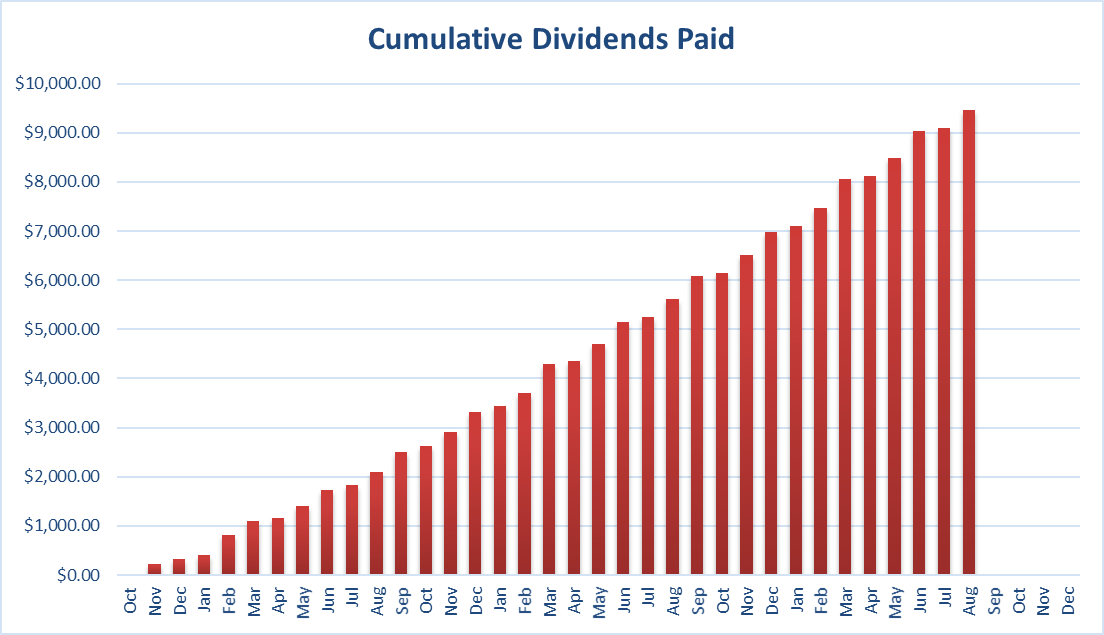
Since I started this portfolio in September 2017, I have received a total of $9,459.05 CAD in dividends. Keep in mind that this is a “pure dividend growth portfolio” as no capital can be added into this account other than dividends. Therefore, all dividend growth is coming from the stocks and not from any additional capital.
Final Thoughts
Before Apple lost about 10% in two days, I was about to sell some more shares to rebalance my portfolio. I didn’t want to do it right away, but my exposure to this company was getting closer to 13% of my portfolio (it was 10% after I sold some shares in June 2020).
AAPL drove my portfolio higher as the stock surged by almost 60% before it rapidly dropped. When I look at all of this, I only see noise. It’s crucial to keep your head straight and focus on your plan. My plan is to keep AAPL close to 10% of my portfolio. If the stock surges again, I’ll sell. If it keeps dropping, I won’t do anything. Why? Because this follows my plan.
Being right or wrong about stock prices isn’t relevant because we don’t know what’s coming up next. Following a straightforward plan is a much better strategy, and the results of my plan speaks for itself.
Cheers,
Mike.
The post August Income Report – The Tech Bubble 20 Years Later appeared first on The Dividend Guy Blog.