
In September of 2017, I received slightly over $100K from my former employer which represented the commuted value of my pension plan. I decided to invest 100% of this money into dividend growth stocks.
Each month, I publish my results. I don’t do this to brag. I do this to show you it is possible to build a lasting portfolio during an all-time highly valued market. The market will inevitably go down, as it did in 2020. But I continued to enjoy cashing consistent and growing dividends despite that negative market action! And, most importantly, I stayed fully invested in the market and have enjoyed the market recovery in 2020 that has continued into this new year of 2021.
Performance in Review
Let’s start with the numbers as of June 7th, 2021 (before the bell):
Original amount invested in September 2017 (no capital added): $108,760.02.
- Portfolio value: $205,552.04
- Dividends paid: $3,877.32 (TTM)
- Average yield: 1.89%
- 2020 performance: +20.3%
- SPY=18.17%, XIU.TO = 5.27%
- Dividend growth: +7.7%
Total return since inception (Sep 2017- May 2021): 89.00%
Annualized return (since September 2017): 18.50%
SPDR® S&P 500 ETF Trust (SPY) annualized return (since Sept 2017): 18.38% (total return 83.27%)
iShares S&P/TSX 60 ETF (XIU.TO) annualized return (since Sept 2017): 11.63% (total return 51.05%)
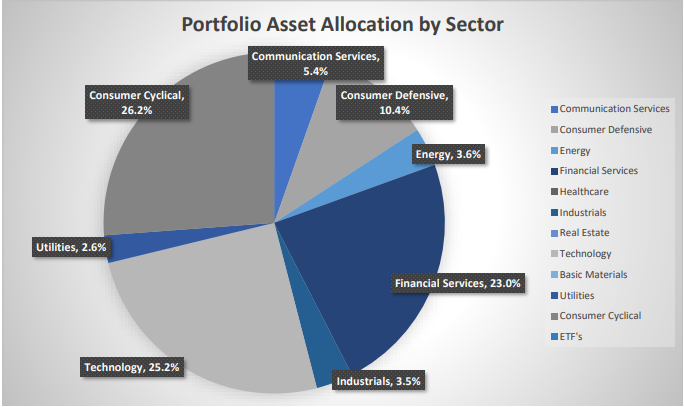
Sector allocation calculated by DSR PRO.
Let’s look at my CDN portfolio. Numbers are as of June 7th, 2021 (before noon):
Canadian Portfolio (CAD)
| Company Name | Ticker | Market Value |
| Algonquin Power & Utilities | AQN.TO | 6441,00 |
| Alimentation Couche-Tard | ATD.B.TO | 15,986.27 |
| Andrew Peller | ADW.A.TO | 6,475.30 |
| National Bank | NA.TO | 7,427.20 |
| Royal Bank | RY.TO | 7,552.80 |
| CAE | CAE.TO | 7,448.00 |
| Enbridge | ENB.TO | 7,649.11 |
| Fortis | FTS.TO | 5,478.66 |
| Intertape Polymer | ITP.TO | 8,436.00 |
| Magna International | MG.TO | 8,621.20 |
| Sylogist | SYZ.TO | 5,838.00 |
| Cash | 475.73 | |
| Total | $87,829.27 |
My account shows a variation of -$157.39 (-0.2%) since the last income report on May 4th. My Canadian holdings were pretty much flat this month. While Alimentation Couche-Tard and the Canadian Banks have gained momentum, Sylogist and Intertape Polymer lost a bit of their hype. I guess this is the advantage of having a well-diversified portfolio as not everything is going down the drain or surging at the same time! We have had more earnings results (including banks!) this quarter.
Algonquin rewards shareholders with a dividend increase.
AQN reported a solid quarter with a double-digit revenue increase and a whopping 10% dividend increase! During the fourth quarter of 2020, the Company announced the completion of two new regulated utility acquisitions and surpassed the milestone of over one million customer connections! AQN had approximately 1,600 MW of renewable energy projects under construction in 2020 between the Renewable Energy Group and Regulated Services Group. This was the largest construction program in the Company’s history and the new projects are expected to approximately double AQN’s renewables portfolio.
National Bank is ready to increase its dividend!
National Bank more than doubled its EPS this quarter. This strong growth was driven by increases in total revenues across most business segments and by a substantial reduction in provisions for credit losses in the second quarter of 2021. In the second quarter of 2020, significant provisions for credit losses had been recorded to reflect a deterioration in the macroeconomic conditions caused by the COVID-19 pandemic. Income before provisions for credit losses and income taxes totaled $1,039M Q2 2021 compared to $915M in Q2 2020 (+14%). With a dividend payout ratio of 38% for the quarter, we can only dream about the next dividend increase once regulators permit it!
Royal Bank is also doing great!
Like other banks, RY reported astonishing EPS growth vs. last year. Results were mainly reflecting constructive markets and strong volume growth, partially offset by the impact of low-interest rates, and higher expenses largely due to higher variable compensation on improved results and higher stock-based compensation. Personal & Commercial Banking and Capital Markets generated solid earnings growth, with Capital Markets reporting record earnings this quarter. Higher results in Wealth Management and Insurance also contributed to the increase. These factors were partially offset by lower results in Investor & Treasury Services.
CAE is not done with the pandemic yet.
The pandemic continues to weigh on CAE’s results. Civil revenue was $388.2M, down 36% vs last year. Civil training center utilization was 55% and has trended at a similar level since the end of the quarter. For the year, Civil booked orders for $1.3B, demonstrating CAE’s continued momentum as the training partner of choice for airlines, business jet operators and pilots worldwide. Defense revenue was $334.4M, down 2% vs last year. Defense booked orders for $370.4M. The acquisition of L3Harris Military Training should help boost results moving forward.
Enbridge plays ping-pong with Line 5
Enbridge reported a stronger than expected profit for the quarter. A year ago, the company took a $1.7B charge related to the value of its investment in DCP Midstream and a $2B charge related to derivatives. Q1 distributable cash flow totaled $2.8B (or $1.37/share), an increase of C$55M over the prior year quarter. The DCF payout ratio for this quarter was 61%. Enbridge affirmed its full-year guidance for the distributable cash flow of C$4.70-C$5.00/share and EBITDA of C$13.9B-C$14.3B. Now, all eyes are turned toward the legal battle around Line 5. ENB has no intention to stop using its current pipeline unless there is a court ruling instructing them to stop.
You search for stability? Look to Fortis!
Fortis reported a strong quarter with double-digit EPS growth. Rate base growth at the regulated utilities driven by record capital investments made in 2020 and new customer rates at Tucson Electric Power (“TEP”) effective during January 2021 contributed to the increase. The increase was tempered by a lower average USD: CAD foreign exchange rate and higher operating costs associated with planned generation maintenance at UNS Energy in 2021. The pandemic did not significantly impact financial results for the first quarter of 2021. The 2021 $3.8B capital plan is on track with $0.9B invested during the first quarter.
Intertape Polymer reports solid numbers
ITP reported an impressive quarter with double-digit growth for both EPS and revenue. Results were driven by an increase in demand for products with significant e-commerce end-market exposure, including water-activated tape and protective packaging, combined with an increase in demand for certain film and woven products. Gross margin increased to 23.9% from 21.2% primarily due to favorable plant performance was driven by increased scale providing leverage on both fixed costs and recent investments, a favorable product mix, and an increase in the spread between selling prices and combined raw material and freight costs.
Sylogist disappoints
Sylogist disappointed the market as its Q2 2021 revenue was $8.9M, a 6% drop from Q2 2020’s revenue of $9.4M. The company said revenue was impacted primarily by a weakened US dollar and from continued purchase delays due to COVID. Sylogist’s CEO Wood says that Sylogist’s sales and acquisition pipelines remain intact, and the company expects to see demand begin to recover in the back half of calendar 2021, possibly sooner. The decrease in earnings was due mainly to lower revenues, higher general and administrative expenses, higher share-based payments, and higher acquisition costs compared to the same period in the prior year.
Here’s my US portfolio now. Numbers are as of June 7th, 2021 (before noon):
U.S. Portfolio (USD)
| Company Name | Ticker | Market Value |
| Apple | AAPL | 11,996.15 |
| BlackRock | BLK | 12,354.58 |
| Disney | DIS | 7,989.75 |
| Gentex | GNTX | 8,109.85 |
| Lazard | LAZ | 4,827.66 |
| Microsoft | MSFT | 15,160.20 |
| Starbucks | SBUX | 9,481.75 |
| Texas Instruments | TXN | 9,392.53 |
| VF Corporation | VFC | 6,423.30 |
| Visa | V | 11,587.00 |
| Cash | 202.51 | |
| Total | $97,525.28 | |
The US total value account shows a variation of -$870.99 (-0.9%) since the last income report on May 4th. Last month, I covered most of my US holdings quarterly reports. This time, I only have two left.
Disney keeps its eyes on streaming services
The only thing that matters about Disney these days is how its streaming services are performing. The company didn’t meet expectations and shares took a beating on earnings day. Disney Plus subscribers were 103.6M vs. 109.3M consensus; ESPN Plus subscribers were 13.8M vs. 13.4M consensus. Revenues fell 13.3% to $15.6B, some $320M short of consensus as streaming didn’t mitigate the parks’ losses as much as expected. Revenue by segment: Disney Media and Entertainment Distribution, $12.4B (up 1%); Disney Parks, Experiences and Products, $3.17B (down 44%). Management is optimistic as the parks and resorts are reopening.
VF Corp missed expectations (and the stock dropped)
While management was happy about their results, the market wasn’t impressed as VF missed both EPS and revenue growth expectations. Shares had lost momentum prior to earnings day, but management reassured investors with better-than-expected guidance. For FY2022, they are predicting revenue to be ~$11.8B vs. the consensus of $11.38B. Adjusted EPS is expected to be $3.05 vs. the consensus of $3.02. Revenue growth was driven by VF’s largest brands, e-commerce growth, and an increase in the APAC region. In April 2021 VF entered into a definitive agreement to sell its Occupational Workwear business. The terms of the agreement were not disclosed.
My Entire Portfolio Updated for Q1 2021
Each quarter, we run an exclusive report for Dividend Stocks Rock (DSR) members who subscribe to our very special additional service called DSR PRO. The PRO report includes a summary of each company’s earnings report for the period. We have been doing this for an entire year now and I wanted to share my own DSR PRO report for this portfolio. You can download the full PDF showing all the information about all my holdings. Results have been updated as of March 2021.
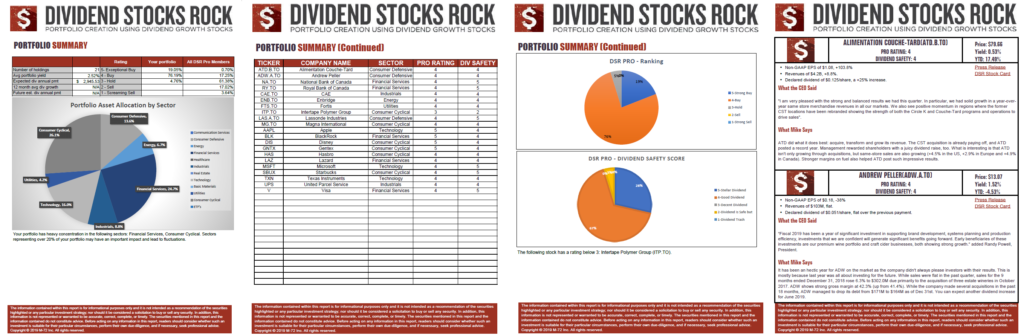
Download my portfolio Q1 2021 report.
Dividend Income: $312.70 CAD (-14% vs May 2020)
I recorded a 14% dividend decrease from May of 2020’s report. However, it is not a “real” decrease. First, last year’s USD: CAD exchange rate was at 1.35: 1 (a 15% currency negative impact on today’s report). Second, Last year II received $31.28 from Hasbro. Since I sold my shares not too long ago (and bought Algonquin which paid dividends last month), I wasn’t eligible for Hasbro’s dividend.
This is also a “bad month” for dividend growth. My two Canadian banks aren’t allowed to pay us more and Lazard is also showing the same amount of dividend paid (another company in the financial service industry).
Here’s the detail of my dividend payments.
Dividend growth (over the past 12 months):
- National Bank: 0%
- Royal Bank: 0%
- Apple: +7.3%
- Hasbro: -100% as I sold my shares
- Texas Instruments: +13.33%
- Starbucks: +9.75%
- Lazard: 0%
Canadian Holdings payouts: $121.60 CAD
- National Bank: $56.80
- Royal Bank: $64.80
U.S. Holding payouts: $158.31 USD
- Apple: $21.12
- Texas Instruments: $51.00
- Lazard: $47.94
- Starbucks: $38.25
Total payouts: $312.70 CAD
*I used a USD/CAD conversion rate of 1.2071
The USD vs CAD isn’t usually a big factor, but there is an important difference from last year. Back in April-May 2020, one U.S. dollar was worth about $1.40 Canadian dollar. We are now down to $1.207. I’m not worried, but just keep in mind that this conversion factor often affects the overall performance of your portfolio.
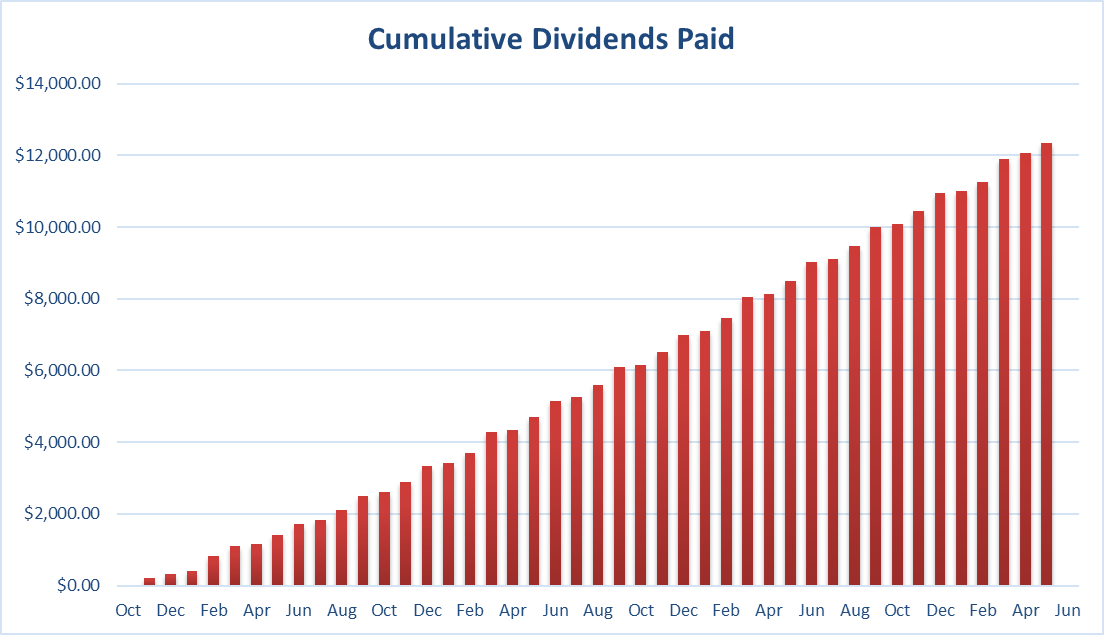
Since I started this portfolio in September 2017, I have received a total of $12,366.80 CAD in dividends. Keep in mind that this is a “pure dividend growth portfolio” as no capital can be added into this account other than retained and/or reinvested dividends. Therefore, all dividend growth is coming from the stocks and not from any additional capital.
Final Thoughts
This portfolio update highlights how currency fluctuations can affect your overall results. Last year, considerable exposure to US stocks helped me pass through the pandemic without much worry. This year, my portfolio lags the indices (I’m up ~7% YTD while XIU is up 13.4% and SPY up 17.5%). My US holdings have lost ~5% in currency value since January.
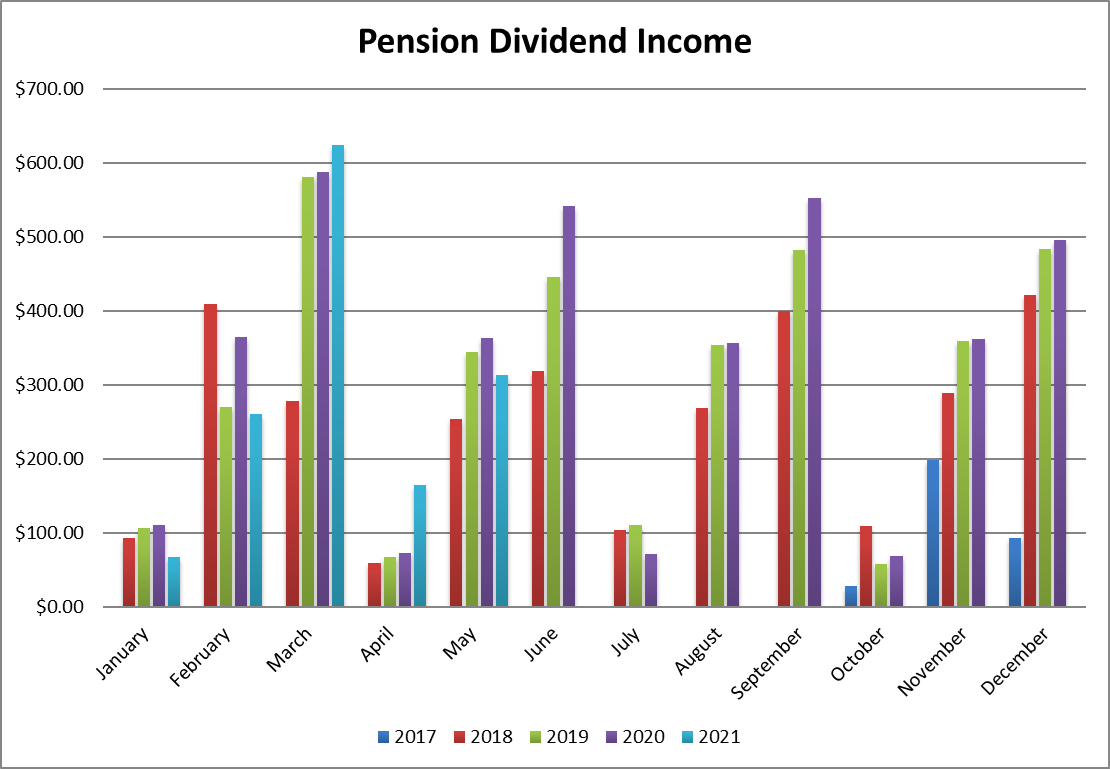
The other factor that doesn’t help my portfolio is my lack of exposure to the energy sector. For example, the BMO Equal Weight Oil & Gas ETF Total Return (ZEO.TO) is up 47% since the beginning of the year. It may have been smart to own energy in 2021. However, I feel a lot better when I zoom out and look at a longer timeframe:
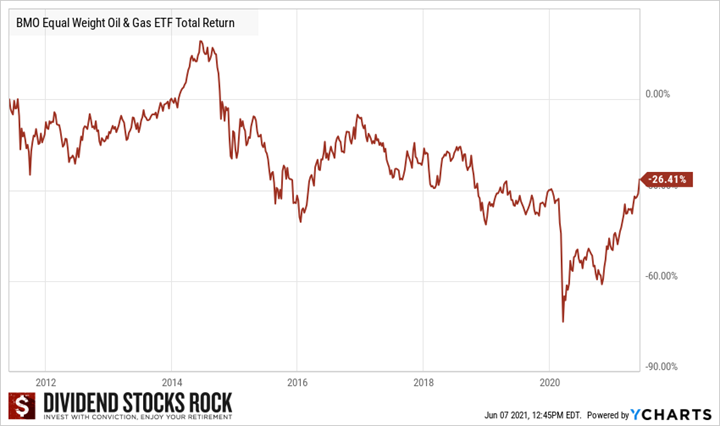
In the end, what works well is to stick to your investment strategy. You will miss on short-term plays, but you will win the long game.
Cheers,
Mike.
The post Winning the Long Game – May Dividend Income Report appeared first on The Dividend Guy Blog.