
In September of 2017, I received slightly over $100K from my former employer, representing the commuted value of my pension plan. I decided to invest 100% of this money in dividend growth stocks.
Each month, I publish my results on those investments. I don’t do this to brag. I do this to show my readers that it is possible to build a lasting portfolio during all market conditions. Some months we might appear to underperform, but you must trust the process over the long term to evaluate our performance more accurately.
Performance in Review
Let’s start with the numbers as of December 2nd, 2022 (before the bell):
Original amount invested in September 2017 (no additional capital added): $108,760.02.
- Portfolio value: $209,133.84
- Dividends paid: $4,497.45 (TTM)
- Average yield: 2.15%
- 2021 performance: +16.78%
- SPY= 28.75%, XIU.TO = 28.05%
- Dividend growth: +3.14%
Total return since inception (Sep 2017-Nov 2022): 92.29%
Annualized return (since September 2017 – 63 months): 13.26%
SPDR® S&P 500 ETF Trust (SPY) annualized return (since Sept 2017): 11.86% (total return 80.11%)
iShares S&P/TSX 60 ETF (XIU.TO) annualized return (since Sept 2017): 9.80% (total return 63.33%)
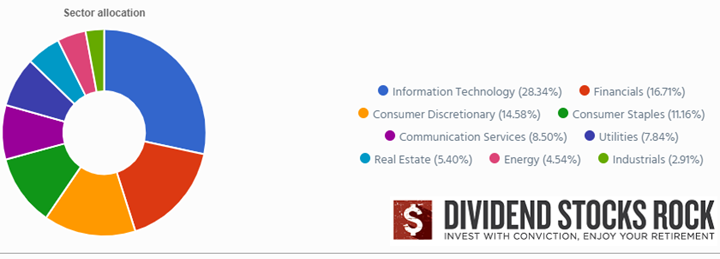
Dynamic sector allocation calculated by DSR PRO as of December 2nd.
Trades that Went Wrong
The number one reason I report my portfolio progress monthly is to create a live case study of how an investor can use a dividend growth investing strategy to reach his or her financial goals. We read hundreds of studies, but it’s all based on theory. The account I report can’t be altered by adding new capital as it is locked in. Therefore, besides dividends and capital gains, nothing can boost its value.
Being 100% transparent has its pros and cons. When it goes well, it’s a nice feeling to share my success. However, I get humbled whenever one of my trades goes south, and when it happens twice in the same month, I really am eating “humble pie.” So, here are the lessons I’ve learned from losing money on Sylogist and Algonquin.
The Sylogist Story
I discovered this small company when it was treated as a mature cash flow machine increasing its dividend steadily. I loved the idea of having a new CEO focused on growth with a business model built around recurring revenues. That screamed of increasing dividends to me. My investment thesis was built around a stable business model (mostly serving Governments, schools, and NGO entities) coupled with a new taste for smart acquisitions. At first, it was a great success and SYZ soared to $18. I should have cashed a part of my profit at that time. Again, playing Monday morning quarterback is easy.
Unfortunately, the CEO wanted to go too fast and decided to destroy SYZ’s dividend and left a quarterly penny for dividend growth investors. I would have preferred he had the courage to delete the word “dividend” from the earnings instead of leaving just a few crumbs.
The investment thesis around growth for this tech stock is still valid today, but I would instead stick to the strategy that has enabled me to beat the market since 2010. Sylogist showed a weak dividend triangle for a while, but I got complacent in this case. It’s time to focus on dividend growers with strong dividend triangles. I sold my shares on the same day the CEO announced the axe has swung into the dividend. End of the story here.
The Algonquin Disaster
A few days before Sylogist dropped its dividend bomb AQN didn’t touch its dividend, but they dropped an H bomb on the market. The market went crazy on bad results and decreased guidance. I even wrote a full report on earnings that was downloaded over 7,000 times. Following that report, two significant things happened. The CEO bought $1.5M worth of shares, and the company issued a letter to shareholders.
The letter was meant to calm things down, but I was highly disappointed by the lack of both confidence and transparency in the letter.
“Algonquin remains focused on driving sustainable long-term profitable growth that supports an investment grade credit rating. Our dividend is an important component of our total shareholder return. We strive to provide a strong and sustainable dividend to our shareholders.”
Those kinds of words sounded empty. As I mentioned in my report, I believe the dividend is safe and that the company generates enough funds from operations to cover their dividend payments. However, this doesn’t mean that while AQN can afford to pay its dividend it will keep it intact. After all, Sylogist showed a payout ratio of 73% during the quarter it slashed its dividend by 92%. AQN has many options on the table and only a handful of people know what will happen.
Will they sell more green assets to strengthen their balance sheet?
Will they sell their stake in Atlantica Yield (worth about $1.3B)
Will they cut the dividend?
Will AQN keep the same aggressive CAPEX going forward?
Will AQN convert a part of their floating-rate debt into fixed rates?
Will Kentucky Power be accreditive in 2023 as expected?
We will not have the answers to those questions until the next Algonquin conference (Investors Day). I decided to hold onto my shares until that date. If they announce a dividend cut, chances are the stock will appreciate a bit and I will follow my investing rules, sell, and move on. If they don’t cut the dividend, I’ll stick around for a while depending on what other information management will share with us.
Trades are coming
Speaking of following my investing rules, I’m in for another modification in my portfolio. Gentex (GNTX) just announced no change in their dividend ($0.12/share). The dividend has remained unchanged since April of 2020. Without any surprises, I decided to sell my shares of Gentex. They are still reported in today’s update as GNTX was part of my portfolio on December 2nd before the opening.
I now have liquidity from the sale of Sylogist and Gentex. I’ll take some time off during the holidays to review my portfolio (using my latest DSR PRO report which will be ready around December 20th!). Air Products & Chemicals (APD) is on top of my list even as the stock has gained a lot of traction as of late.
My choices aren’t made yet, but I will focus on companies showing a strong dividend triangle. I want to strengthen my portfolio to keep my streak of dividend income growth intact. My portfolio diversification strategy served me well with Sylogist and Algonquin. While both stocks dropped by about 50%, it wasn’t enough to drag my portfolio down.
Smith Manoeuvre Update
So far, I’m almost breaking even with my strategy. I didn’t expect much from this portfolio over the first few months. I still need to give it some time to perform (especially considering this crazy market).
I previously initiated a pause in my SM contributions. In the coming months, I will maintain my investment update, but I will not add another $500 monthly for a while. My trip to Africa got out of control and I must take a few months to recover financially. When you do a leveraged strategy, you should never invest money you don’t have. I’m following my own advice. I’ll resume my monthly investments shortly, but I would rather play it safe.
Fortunately, my investments are doing well, and my finances are slowly but surely getting back under control, so I expect to resume my strategy in the second quarter of 2023.
Here’s my portfolio as of December 2nd, 2022 (before the bell):
| Company Name | Ticker | Sector | Market Value |
| Canadian Net REIT | NET.UN. V | Real Estate | $403.00 |
| National Bank | NA.TO | Financials | $575.16 |
| Exchange Income | EIF.TO | Industrials | $531.52 |
| Brookfield Infrastructure | BIPC.TO | Utilities | $552.06 |
| Great-West Lifeco | GWO.TO | Financials | $535.67 |
| Cash (Margin) | $6.05 | ||
| Total | $2,603.46 | ||
| Amount borrowed | -$2,500.00 |
Let’s look at my CDN portfolio. Numbers are as of December 2nd, 2022 (before the bell):
Canadian Portfolio (CAD)
| Company Name | Ticker | Sector | Market Value |
| Algonquin Power & Utilities | AQN.TO | Utilities | $4,261.74 |
| Alimentation Couche-Tard | ATD.TO | Cons. Staples | $22,153.89 |
| Brookfield Renewable | BEPC.TO | Utilities | $6,139.14 |
| CAE | CAE.TO | Industrials | $5,818.00 |
| Enbridge | ENB.TO | Energy | $8,556.61 |
| Fortis | FTS.TO | Utilities | $5,359.86 |
| Granite REIT | GRT.UN.TO | Real Estate | $10,246.40 |
| Magna International | MG.TO | Cons. Discre. | $5,791.10 |
| National Bank | NA.TO | Financials | $11,599.06 |
| Royal Bank | RY.TO | Financial | $8,080.20 |
| Cash | 3,499.15 | ||
| Total | $91,805.15 |
My account shows a variation of +$2,375.63 (+2.7%) since the last income report on November 2nd.
All companies reported their earnings recently. Here’s the full tour!
Algonquin Power & Utilities sucks
Algonquin upset the market on earnings day as management revised guidance for the full year 2022. New EPS for full 2022: from $0.72-$0.77 to a range of $0.66-$0.69 vs. consensus of $0.74. EPS for the quarter was down 27%, impacted by higher interest (a larger debt for acquisition didn’t help) and lower tax credits related to certain renewable energy projects. AQN also announced the sale of part ownership of operating wind facilities in the U.S. and Canada for $354M USD. It’s part of their management asset recycling strategy (selling assets to unlock profit and use proceeds to invest in additional growth).
Alimentation Couche-Tard is crushing it!
It’s moving fast at Couche-Tard as the company reported revenue growth of 19% and adjusted EPS growth of 26%. Strong results were driven by higher road transportation fuel gross profits, by organic growth in the convenience activities (Same-store merchandise revenues increased by 5.6% in the U.S., +2.9% in Europe and other regions, and -1.5% in Canada.). ATD has many new projects on the table such as public EV-chargers, smart checkout technology, a new loyalty program in the U.S., and a new tiered concept in Europe. ATD isn’t waiting for changes to hit the company as it’s going to hit the industry with changes. The company boosted its dividend by 27% which earns them a big congratulations!
Brookfield Renewable reports double-digit growth
Brookfield Renewable reported double-digit growth and beat both FFO per share (+15%) and revenue (+14%) growth expectations. BEP is running full speed as it closed on secured investments of up to $6B ($1.5B net to Brookfield Renewable) of capital across various transactions and regions. They secured contracts to deliver an incremental 2,600-gigawatt hours of clean energy annually and commissioned approximately 2,700 megawatts of new projects. The utility company maintains robust financial capacity with over $3.5 billion of available liquidity, no material near-term maturities, and limited floating rate exposure. Expect more projects to come!
CAE shows some hope!
CAE did a lot better than last quarter with revenue up 22% and EPS up 12%. Second quarter Civil revenue was $507.2M vs. $362.1M (+40%). During the quarter, Civil delivered ten full-flight simulators (FFSs)(5) to customers and second quarter Civil training center utilization was 66% (vs 53% last year). Defense revenue was up $442.4 million, up 6% while backlog was up 13%. Net cash provided by operating activities was $138.0 million for the quarter, compared to $30.9 million. The increase was mainly due to higher cash provided by operating activities.
Enbridge keeps the dividend streak alive
Enbridge reported 10% distributable cash flow per share growth this quarter. Q3 distributable cash flow climbed to $2.5B, or $1.24/share, from $2.3B, or C$1.13/share in the same period last year. The company said the increase was due in part to a ~$1B gain on the closing of its joint venture deal with Phillips 66. ENB delivered nearly 3M bbl/day of oil on its Mainline system vs. 2.7M bbl/day a year ago. The company reaffirmed FY 2022 financial guidance which includes adjusted EBITDA of C$15B-C$15.6 and DCF of C$5.20-C$5.50/share. ENB said it has sanctioned and is proceeding with a 300M mcf/day expansion of the southern segment of its B.C. Pipeline natural gas system. The Company announced a 3% dividend increase for 2023.
Fortis goes with a 6% dividend increase!
Fortis reported Q3 2022 EPS of $0.68, representing an 8% increase versus Q3 2021. Revenue reported for the quarter was $1.88B representing a 6% increase versus Q3 2021 and beating estimates by $118M. The increase in earnings was driven by rate base growth, mainly at ITC, higher retail sales, transmission revenue and earnings associated with the Oso Grande generating facility in Arizona. New customer rates at Central Hudson and the mark-to-market accounting of natural gas derivatives at Aitken Creek also favorably contributed to results. Finally, the company declared a dividend payment of $0.565, representing a 6% increase versus the previous quarter.
Granite REIT is the best industrial REIT
Granite REIT reported another good quarter with revenue up double-digits (+14%) and FFO per unit up 4.3%. GRT’s growth was mostly driven by new acquisitions and contractual rent adjustments. On August 19, 2022, Granite acquired a 10.1-acre parcel of land northeast of the Rest Acres Road and Highway 403 interchange in Brant County, Ontario for $6.4 million. Granite recognized $229.2 million in net fair value losses on investment properties, mostly due to higher interest rates. The REIT also announced another distribution increase of 3.2%. The AFFO payout ratio was 80% for the third quarter of 2022 compared to 81% in the third quarter of 2021.
Magna International is getting back on track
Things are slowly getting back to normal for Magna International The company reported a sales increase of 17% to $9.3B compared to a global light vehicle production increase of 24%. Unfortunately, the company reduced its 2022 outlook reflecting expected lower vehicle production in North America and Europe and higher operating inefficiencies. They guided for total sales of $37.4 – $38.4B vs. analysts’ consensus of $37.76B. During the quarter, Magna generated cash from operations before changes in operating assets and liabilities of $591M and used $353M in operating assets and liabilities. It also used $180M to buy back shares. That’s a pretty good deal at their current price per share.
National Bank didn’t report the best quarter
NA reported an okay quarter with revenue up 5%, but EPS down 4%. At least, there was a generous dividend increase of 5.4%. P&C net income was up 13%, Wealth Management +24% (higher net interest income), Capital Markets -14% due to higher provisions for credit losses, US + Intl markets +2% (stronger revenue from ABA Bank, lower from Credigy). NA’s results were affected by lower treasury activities revenues along with a higher gain on investment last year. The bank took $87M in provisions for credit losses while it shows a reduction of $41M last year (therefore the quarter included an impact of +$128M in provisions).
Royal Bank did a lot better!
RY reported a relatively flat quarter as revenues went up by 1.5% and EPS was up by 2%. Earnings were affected by higher PCL ($381M vs $227M last year), reflecting provisions taken on performing loans and higher provisions on impaired loans in the current quarter, as compared to releases of provisions on performing loans in the prior year, primarily in Personal & Commercial Banking. P&C earnings went up 5% (strong volume, but higher PCL), Wealth management +47% (impact of a legal provision in the U.S.), Insurance was flat, and Capital markets went down 33% primarily due to the timing of true-ups related to RY’s variable compensation plans.
Here’s my US portfolio now. Numbers are as of December 2nd, 2022 (before the bell):
U.S. Portfolio (USD)
| Company Name | Ticker | Sector | Market Value |
| Activision Blizzard | ATVI | Communications | $8,722.04 |
| Apple | AAPL | Inf. Technology | $11,123.25 |
| BlackRock | BLK | Financials | $10,110.52 |
| Disney | DIS | Communications | $4,436.55 |
| Gentex | GNTX | Cons. Discret. | $6,833.80 |
| Microsoft | MSFT | Inf. Technology | $14,007.95 |
| Starbucks | SBUX | Cons. Discret. | $8,786.45 |
| Texas Instruments | TXN | Inf. Technology | $8,875.00 |
| VF Corporation | VFC | Cons. Discret. | $2,711.88 |
| Visa | V | Inf. Technology | $10,850.00 |
| Cash | $594.56 | ||
| Total | $87,052.00 |
The US total value account shows a variation of +$8,232.34, (+10.44%) since the last income report on November 2nd. Please note that I’ll be selling my shares of Gentex in December.
My Entire Portfolio Updated for Q3 2022
Each quarter we run an exclusive report for Dividend Stocks Rock (DSR) members who subscribe to our very special additional service called DSR PRO. The PRO report includes a summary of each company’s earnings report for the period. We have been doing this for an entire year now and I wanted to share my own DSR PRO report for this portfolio. You can download the full PDF showing all the information about all my holdings. Results have been updated as of October 5th, 2022.
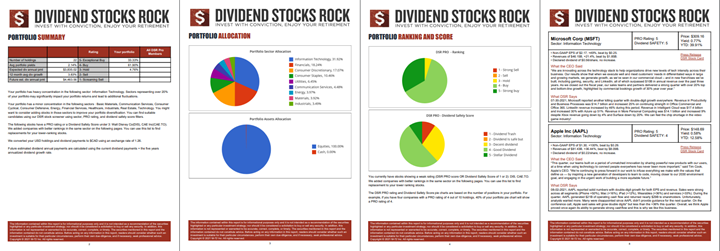
Download my portfolio Q3 2022 report.
Dividend Income: $388.71 CAD (-15.48% vs November 2021)
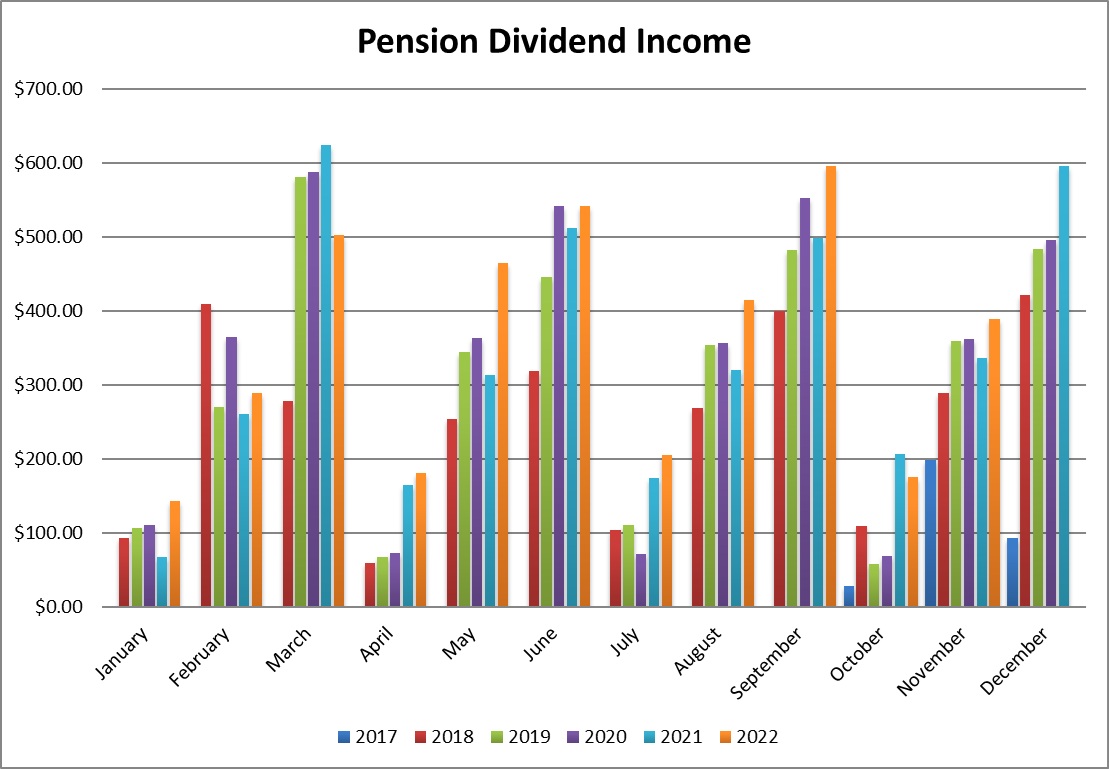
This was a very good month vs. last year even though I sold my shares of Lazard in the meantime. I also boosted the number of shares in National Bank and Texas Instruments, and Royal Bank and Starbucks increased their dividend over the past 12 months. The strong USD also helped pushing my US dividends up by 7% when converted into CAD!
I can now also count on a $33 distribution coming monthly from Granite!
Here’s the detail of my dividend payments.
Dividend growth (over the past 12 months):
- National Bank: +96% (more shares added)
- Granite: new
- Royal Bank: +18.5%
- Apple: -18% (sold some shares)
- Texas Instruments: +7.8%
- Starbucks: +8.2%
- Currency factor: +7%
Canadian Holding payouts: $221.18 CAD
- National Bank: $111.32
- Granite: $33.06
- Royal Bank: $76.80
U.S. Holding payouts: $124.30 USD
- Apple: $17.25
- Texas Instruments: $62.00
- Starbucks: $45.05
Total payouts: $388.71 CAD
*I used a USD/CAD conversion rate of 1.3478
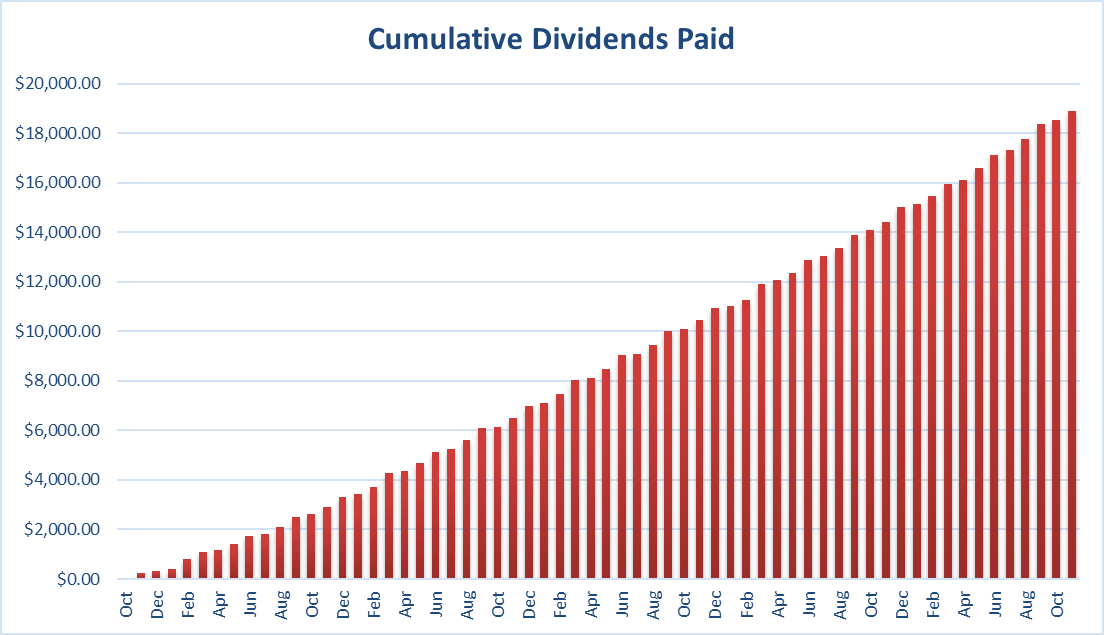
Since I started this portfolio in September 2017, I have received a total of $18,911.44 CAD in dividends. Keep in mind that this is a “pure dividend growth portfolio” as no capital can be added to this account other than retained and/or reinvested dividends. Therefore, all dividend growth is coming from the stocks and not from any additional capital being added to the account.
Final Thoughts
Strangely enough, while I lost money on Sylogist and Algonquin, my portfolio is still showing strong results. Two factors explain why my portfolio keeps beating the market. #1 Diversification plays a major role in my strategy. At the beginning of 2022, SYZ and AQN represented a total of 5% of my portfolio. Going down ~2.5% on those two trades didn’t hurt my portfolio that much. #2 Letting my winners run. I have plenty of “core holdings” that are doing incredibly well in my portfolio. Those strong results have supported the overall portfolio value during the stormy days.
Expect some movements in my January update as I’ll spend the Holidays doing some rebalance trades!
Cheers,
Mike.
The post The Trades that Went Wrong – November Dividend Income Report appeared first on The Dividend Guy Blog.