
In September of 2017, I received slightly over $100K from my former employer which represented the commuted value of my pension plan. I decided to invest 100% of this money into dividend growth stocks.
Each month, I publish my results. I don’t do this to brag. I do this to show you it is possible to build a lasting portfolio during an all-time highly valued market. The market will inevitably go down, as it did in 2020. But I continued to enjoy cashing consistent and growing dividends despite that negative market action! And, most importantly, I stayed fully invested in the market and have enjoyed the market recovery in 2020 that has continued into this new year of 2021.
Performance in Review
Let’s start with the numbers as of July 5th, 2021 (before the bell):
Original amount invested in September 2017 (no capital added): $108,760.02.
- Portfolio value: $213,422.79
- Dividends paid: $3,846.92 (TTM)
- Average yield: 1.80%
- 2020 performance: +20.3%
- SPY=18.17%, XIU.TO = 5.27%
- Dividend growth: +7.7%
Total return since inception (Sep 2017- June 2021): 96.23%
Annualized return (since September 2017 – 46 months): 19.23%
SPDR® S&P 500 ETF Trust (SPY) annualized return (since Sept 2017): 17.95% (total return 88.28%)
iShares S&P/TSX 60 ETF (XIU.TO) annualized return (since Sept 2017): 11.74% (total return 53.03%)
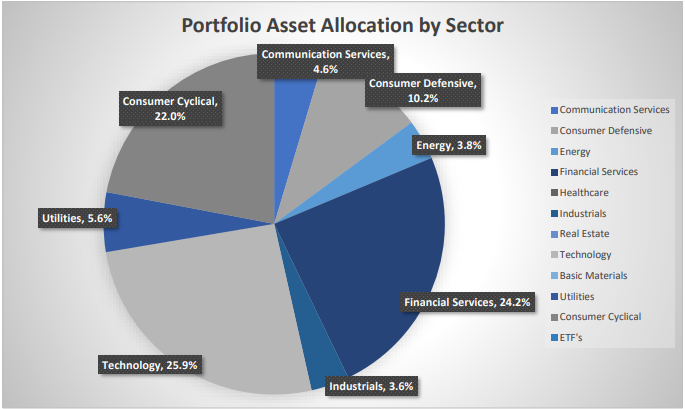
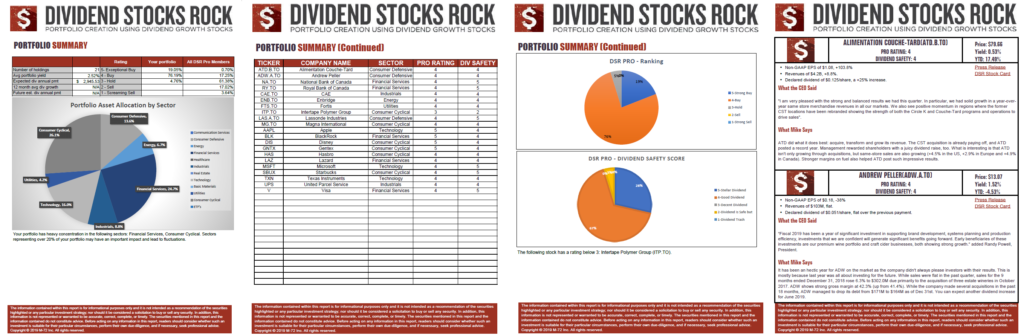
Sector allocation calculated by DSR PRO.
Why I Will Not Invest in Oil & Gas
Last month, I ended my portfolio update with a mention of the oil & gas sector. As the entire industry shows a return of 50% since the beginning of the year, it could be tempting to chase the next shiny things, right?
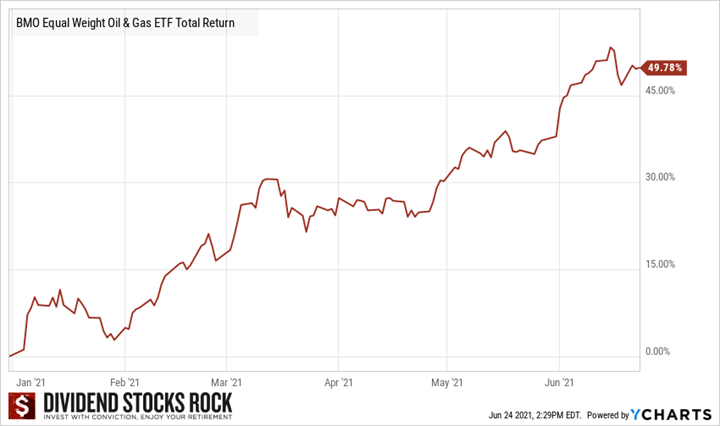
The energy sector has been on a roll that has not seemed to fade. If you are following economic news, you will likely read a bunch of articles telling you how the oil barrel should reach $100 (or more) in no time. Could this happen or is it just more noise to distract you from your investment strategy?
First, looking at the past 10 years, I see a lot of volatility, much speculation, but no indications that oil & gas could be good for a dividend growth portfolio. In fact, we had more downs than ups which led many energy companies to not only cut down their CAPEX, but also their distributions to stockholders. Therefore, if you have been holding energy stocks for a few years (up to a decade), you are not making a single dollar of profit today.
Second, while CAPEX has decreased in the oil & gas industry, it has incredibly increased in another sector: renewable energy!
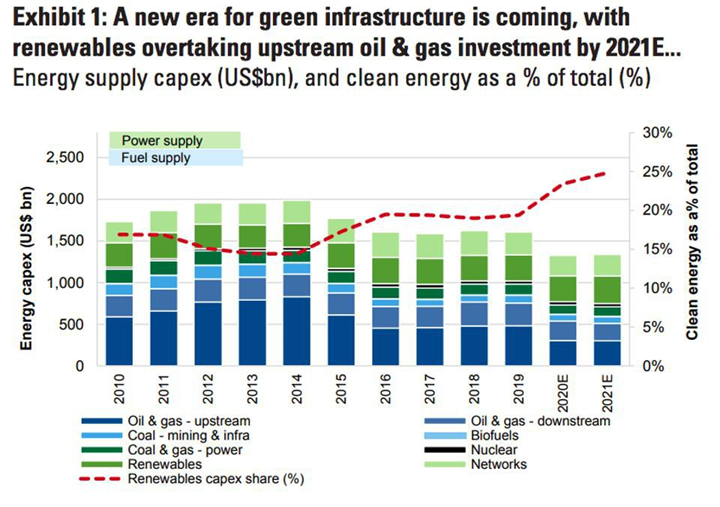
Based on this data, the supply of green energy will continue to rise moving forward. This will likely help to compensate for the lack of investment in oil & gas. If we can replace “dirty energy” with “green energy”, we will all live in a better world.
A few months ago, I invested in Algonquin Power & Utilities (AQN.TO) because of its investments in renewable energy. I am now contemplating the possibility of investing in Brookfield Renewable Energy (BEPC.TO) for the same reason. I’ll leave the oil and gas part of the energy sector to those who know better when to get in and (most importantly) when to get out.
Let’s look at my CDN portfolio. Numbers are as of July 5th, 2021 (before the bell):
Canadian Portfolio (CAD)
| Company Name | Ticker | Market Value |
| Algonquin Power & Utilities | AQN.TO | 6,288.45 |
| Alimentation Couche-Tard | ATD.B.TO | 16,808.38 |
| Andrew Peller | ADW.A.TO | 5,567.00 |
| National Bank | NA.TO | 7,455.20 |
| Royal Bank | RY.TO | 7,561.80 |
| CAE | CAE.TO | 7,773.00 |
| Enbridge | ENB.TO | 8,074.15 |
| Fortis | FTS.TO | 5,421.24 |
| Intertape Polymer | ITP.TO | 8,781.00 |
| Magna International | MG.TO | 8,044.40 |
| Sylogist | SYZ.TO | 5,812.98 |
| Cash | 585.46 | |
| Total | $88,130.06 |
My account shows a variation of +$300.79 (+0.34%) since the last income report on June 7th.
Alimentation Couche-Tard is gaining momentum.
Couche-Tard reported its earnings on June 29th after the market close. However, it was worth the wait. Couche-Tard reported a strong quarter with double-digit revenue growth, mainly attributable to a higher average road transportation fuel selling price. Convenience performed well on a 2-year basis and categories most impacted by COVID-19, such as food, are showing positive trends. Same-store merchandise revenues increased 8.1% in the U.S., 9.7% in Europe and other regions, and 1.6% in Canada. Road transportation fuel gross margin of 34.45¢ per gallon in the U.S, a decrease of 10.48¢ per gallon due to the unusually high fuel margins of the comparable quarter. Fuel margins continue to be higher than the 2019 level.
Comment by the CEO:
“Across the board, we had positive trends in same-store merchandises sales and fuel volumes as traffic is returning to our locations. While fuel volumes remained impacted by restrictive measures, we had a steady improvement in parts of the network, especially in the U.S., where we are starting to see a return to more normal driving behavior. We also continued to realize good fuel margins in all regions of the business, despite rising product costs. Once again, this quarter, fifteen months into the pandemic, our operation teams have done an exceptional job in their continual commitment to the business and care for our customers.”
Tecsys reported double-digit growth
TCS reported a good quarter with double-digit revenue growth. SaaS revenue increased by 107% to $5.5M in Q4 2021, up from $2.7M in Q4 2020. Cloud, maintenance, and subscription revenue increased 30% year-over-year to $13.8M in Q4 2021, up from $10.6M in Q4 2020. The performance was primarily driven by SaaS. Annual Recurring Revenue (ARRi) at April 30, 2021, was up 9%. This means more cash flow coming in year after year. During Q4 2021, SaaS subscription bookings (measured on an ARRi basis) were $3.5M, down 14% compared to a record $4.1M last year but up 252% sequentially from $1M in Q3 2021.
Comment by the CEO:
“We are pleased by our record results as we wrap up an extraordinary year. Our performance for the fourth quarter of fiscal 2021, as well as full year, is a testament to the need for truly adaptable and agile solutions. It was humbling to watch our clients adapt their businesses with the help of our solutions in the midst of a pandemic. As we report our ninth straight quarter of record revenue, as well as several notable wins over the last year, we are ready to hit the ground running into FY22 with a very strong pipeline. Our strategy to transition to a SaaS model is proving to be a home run for Tecsys.”
Here’s my US portfolio now. Numbers are as of July 5th, 2021 (before the bell):
U.S. Portfolio (USD)
| Company Name | Ticker | Market Value |
| Apple | AAPL | 13,436.16 |
| BlackRock | BLK | 12,510.82 |
| Disney | DIS | 7,969.95 |
| Gentex | GNTX | 7,877.20 |
| Lazard | LAZ | 4,750.14 |
| Microsoft | MSFT | 16,659.00 |
| Starbucks | SBUX | 9,772.45 |
| Texas Instruments | TXN | 9,610.50 |
| VF Corporation | VFC | 6,839.64 |
| Visa | V | 11,931.50 |
| Cash | 333.62 | |
| Total | $101,690.98 | |
The US total value account shows a variation of $4,165.70 (+4.27%) since the last income report on June 7th.
Disney keeps its eyes on streaming services.
My Entire Portfolio Updated for Q2 2021
Each quarter, we run an exclusive report for Dividend Stocks Rock (DSR) members who subscribe to our very special additional service called DSR PRO. The PRO report includes a summary of each company’s earnings report for the period. We have been doing this for an entire year now and I wanted to share my own DSR PRO report for this portfolio. You can download the full PDF showing all the information about all my holdings. Results have been updated as of June 2021.
Download my portfolio Q2 2021 report.
Dividend Income: $511.33 CAD (-5.6% vs June 2020)
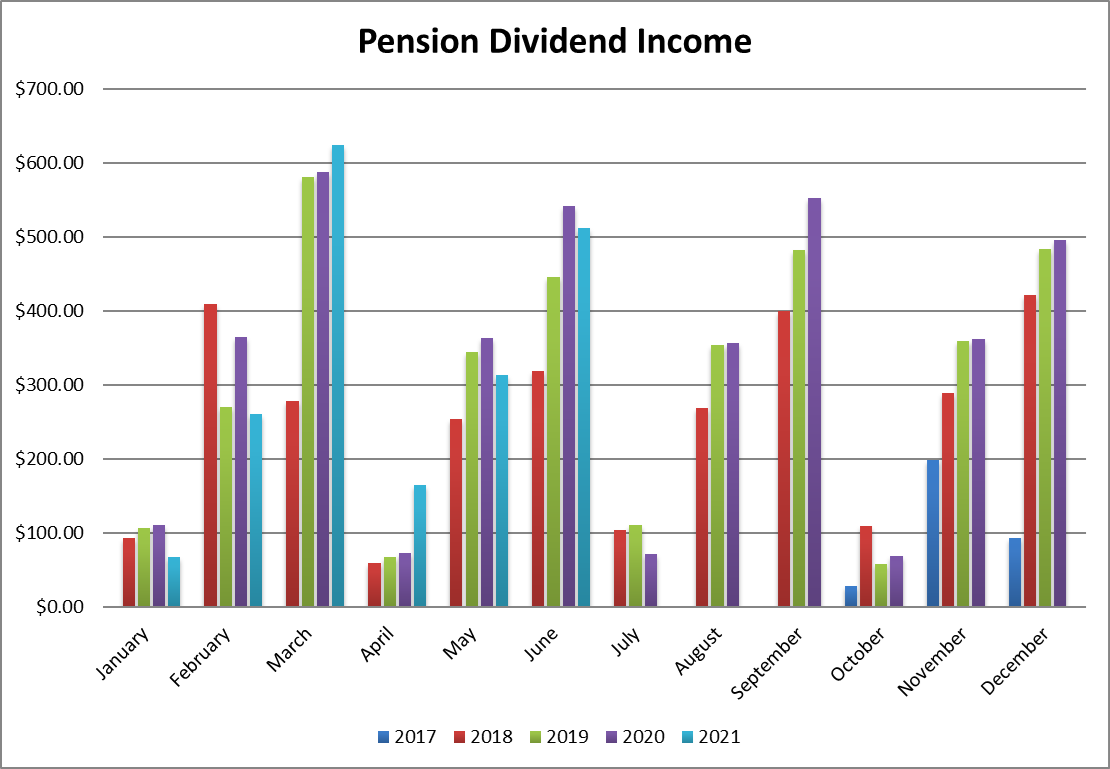
My dividend payment decreased by 5.6% this quarter (vs June 2020) while most of my companies show a dividend increase. The decrease in dividend is explained by currency fluctuation (Magna and Intertape pays in USD). Last year, the exchange rate was at $1 USD = $1.359 CAD. Today, we are at $1 USD = $1.2321 CAD.
The second reason is that I sold my UPS shares. Therefore, I’m missing about $40 in dividend from UPS this month. I’ll recover more dividend in the future as Algonquin (AQN) pays a higher yield.
Here’s the detail of my dividend payments.
Dividend growth (over the past 12 months):
- Fortis: +5.8%
- Enbridge: +3%
- Magna International: -3% (currency fluctuation)
- Sylogist: +13.65%
- Intertape Polymer: -4.2% (currency fluctuation)
- Visa: +6.7%
- Microsoft: +9.8%
- VF Corp: +37.8% (more shares)
- BlackRock: +13.78%
- Currency factor: -12.69%
Canadian Holdings payouts: $330.08CAD
- Fortis: $50.00
- Enbridge: $134.44
- Magna International: $35.91
- Sylogist: $52.13
- Intertape Polymer: $57.60
U.S. Holding payouts: $147.11 USD
- Visa: $16.00
- Microsoft: $33.60
- VF Corp: $39.69
- BlackRock: $57.82
Total payouts: $511.33 CAD
*I used a USD/CAD conversion rate of 1.2321.
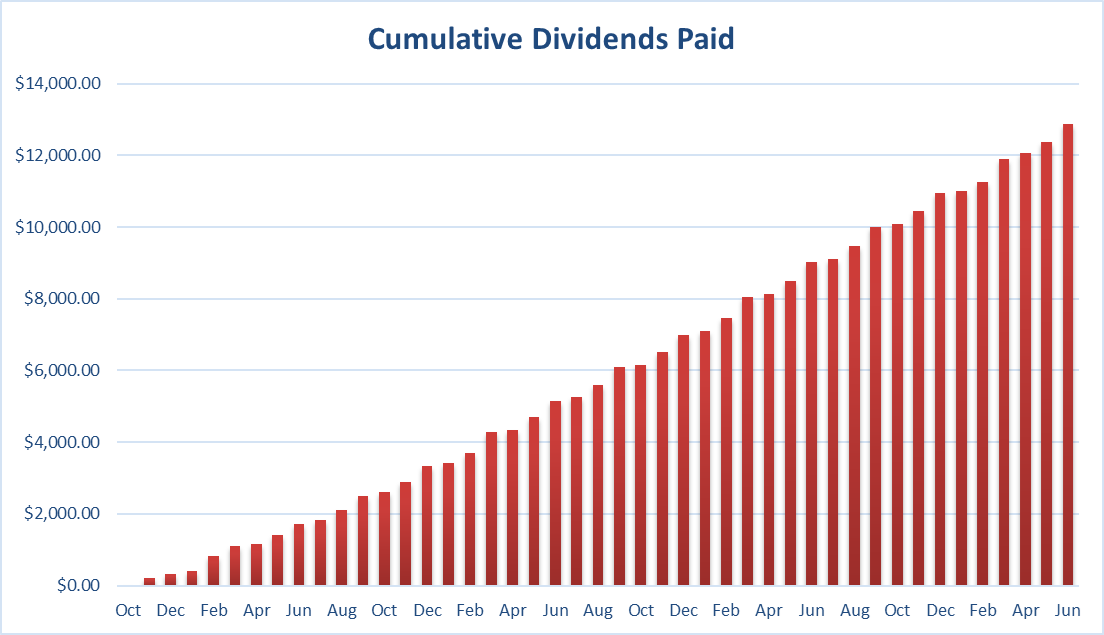
Since I started this portfolio in September 2017, I have received a total of $12,878.13 CAD in dividends. Keep in mind that this is a “pure dividend growth portfolio” as no capital can be added into this account other than retained and/or reinvested dividends. Therefore, all dividend growth is coming from the stocks and not from any additional capital.
Final Thoughts
I mentioned in this newsletter that I may very well buy shares of Brookfield Renewable. Please note it may not happen in my “pension plan portfolio” as I like how it is invested right now. I will likely sell some assets in my Registered Savings Plan (RRSP) to complete the transaction. So don’t be surprised if you don’t see BEPC in this portfolio update later this summer!
Cheers,
Mike.
The post Why I Will Not Invest in Oil & Gas – June Dividend Income Report appeared first on The Dividend Guy Blog.