After completing a session of “Dividend Questions from the Mailbag” a few weeks ago, I enjoyed a very interesting discussion with one of my readers, Robert from Dividend Growth Investing. We were looking at the popular way of taking the payout ratio as a good indication to determine a company’s ability to distribute its dividend over time.
Those who follow this blog know that this is the metric I use personally when I filter stocks to select the best according to my criterion. I completely ignore stocks with a payout ratio exceeding 100% and tend to never go higher than 75% unless there is a very good reason explaining a temporary increase.
In the past, I have proven that calculating the payout ratio of a company is not as simple as dividing dividend per share by earnings. Depending on the data you use, the % could be quite different. But there are more flaws attached to the Dividend Payout Ratio… Here’s what Robert highlighted in our conversation we had so you can understand where I’m coming from…
Robert:
“I believe that a strong argument can be made that a payout ratio should actually not be based on earnings, but rather on “free” cash flow. Dividend payouts are a cash expense, and come from available cash. So, why not just look at the proportion of available cash that dividends require, and refer to that as the payout ratio. I know that almost no one does this, but some analysts do advocate it. I think that your readers would be well-advised to consider the use of earnings as a basis for payout ratios as very misguided, especially for dividend growth investors.
There are all sorts of reasons why payout ratios using free cash flow could be different from payout ratios using earnings. For large, stable companies not undergoing restructuring or reorganization, Net Income (not earnings per share) is generally slightly below or equal to operating income or “total income from operations”. At least, it should be. Anyways, if one further positions that capital expenditures are somewhat steady over the years, then the free cash of such companies, and the net income figures, should be close to one another as a basis for something called a payout ratio. But for all other companies, the two will typically not be anywhere near the same or even close. But we don’t really have to deal with this question on a company by company basis, if we look to free cash flow in the first place. And why not? Dividend growth investing has a big hurdle to get over, and that is finding companies with lots of extra money, and that are willing to give it to us in a rising dividend. It’s the second part that will make a dividend growth investor successful. And where is the “extra” money reported? It is on the cash flow statement, and it is very easy to compute just how much of this the company is willing to give out, vs. other uses. Again, why not?
Back to your original question. One would look at all of the non-cash entries on an income statement, and then post large changes in one or several of them. Any of these could result in significant impacts on income and thus earnings, but not the cash flow statement. The most likely candidates for significant impacts are various types of “write-offs”, tax changes, and large depreciation charges. These and others can cause large fluctuations in net income and earnings per share figures, but would not be reflected in total cash from operations. But again, the critical factor for dividend growth investors is whether management and corporate culture/philosophy is dedicated to giving us their extra money, and this would come from cash, not (strictly) “earnings”.
There is a cultural factor involved, I believe. That is, there is peer pressure in the investment market to use “popular” payout ratio numbers. To not do so would put a burden on someone to prove that their way is better than almost all other analysts. Very few people have the personality to be put into this position, so everyone uses earnings as a basis for payout ratios. But “popularity” does not make it valid or useful for the purposes of dividend growth investing.”
Using Dividend Payout Ratio Main Flaws
As I mentioned at the beginning of this article, the payout ratio could be calculated from various data (leading or trailing dividend, leading or trailing earnings, special dividends, adjusted earnings, etc). In order to avoid this problem, I’ve decided to use consistent sources of payout ratio. I use Bloomberg data most of the time and Ycharts since I’ve subscribed to their Advanced plan (which is truly awesome to maintain a blog like this!). Since I always use the same source, I can see a trend for each stock I follow and this is a great alternative to opening each financial statement and determining which data to use by myself each time I want to calculate one stock.
Unfortunately, this is not the only reason why using the dividend payout ratio is debatable. Dividend payments are coming from cash as earnings were invented by accountants and do not only include real cash. Imagine a company paying a $1.00 dividend per share and having earnings of $2.00 per share. At first, we think it’s a great company since the payout ratio is 50%. However, if you dig into the earnings calculation, you realize that $0.50 per share from the earnings is due to amortization. Amortization reduces the profits but has absolutely no impact on the company’s bank accounts. At the same time, there is real money coming out of the account to pay the dividend. Accountants could play around the numbers to make earnings look better but they can’t fool around with the cash flow statement where the cold hard cash is sitting. This is probably why Robert mentions the Free Cash Flow as an alternative.
I never thought of using the Free Cash Flow to calculate dividend payout sustainability. I am well aware of the Dividend Payout ratio flaws but I was ok with it as I am looking for other metrics as well (such as increasing sales and EPS). So, let’s take a look at a deeper analysis into using the Free Cash Flow.
The Dividend Payout Ratio Alternative with the Free Cash Flow (FCF)
What is great about the Free Cash Flow is obviously that the cash is generated “for real” and exists in the bank account.
The first thing I did is take 6 stocks from my own Dividend Holdings. I compared the dividend payout ratio using the Earnings and using the Free Cash Flow to see if it makes a difference. The Cash flow used was the one in the most recent quarters (all data coming from Ycharts).
| Company | Ticker | FCF ($B) | NB Shares (B) | FCF Per Share | Quaterly Dividend ($) | FCF Payout Ratio | EPS | Payout Ratio |
|---|---|---|---|---|---|---|---|---|
| Johnson & Johnson | JNJ | 1,691 | 2,81 | $0,60 | $0,66 | 109,67% | $3,68 | 71,74% |
| Chevron | CVX | -2,478 | 1,94 | -$1,28 | $1,00 | -78,29% | $13,23 | 30,23% |
| Intel | INTC | 2,078 | 4,97 | $0,42 | $0,22 | 52,62% | $2,00 | 44,00% |
| Coca-Cola | KO | -0,002 | 4,43 | $0,00 | $0,28 | -62020,00% | $1,89 | 59,26% |
| McDonald’s | MCD | 1,053 | 1 | $1,05 | $0,77 | 73,12% | $5,39 | 57,14% |
| Apple | AAPL | 10,2 | 0,94 | $10,85 | $3,05 | 28,11% | $41,89 | 29,12% |
The first shocking result is that both Chevron (CVX) and Coca-Cola (KO) are showing negative payout ratio with the Free Cash Flow. OMG! I won’t be getting my dividend next quarter!!!
I knew there was something weird with this so I went into the Free Cash Flow history of all my stocks. Here’s what I got from KO and Johnson & Johnson (JNJ):

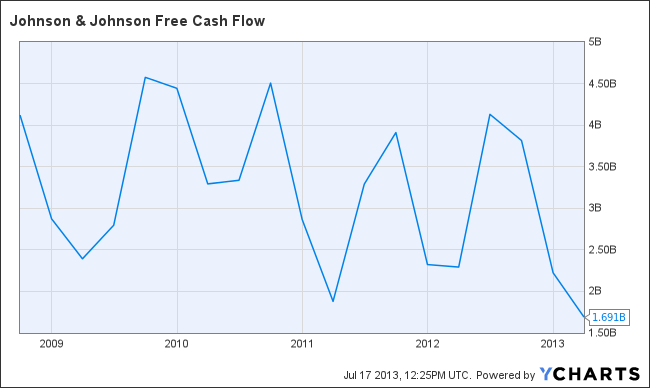
****JNJ FCF
As you can see, the Free Cash Flow varies greatly from quarter to quarter. That’s only normal since it is directly related to the company’s operations. Sometimes you carry a high balance and sometimes you are temporarily short on cash. I’ve reviewed my chart and pulled out the highest FCF level in the past 4 quarters to give my stocks a chance. Here’s the new result:
| Company | Ticker | FCF ($B) | NB Shares (B) | FCF Per Share | Quaterly Dividend ($) | FCF Payout Ratio | EPS | Payout Ratio |
|---|---|---|---|---|---|---|---|---|
| Johnson & Johnson | JNJ | 4,13 | 2,81 | $1,47 | $0,66 | 44,91% | $3,68 | 71,74% |
| Chevron | CVX | 2,29 | 1,94 | $1,18 | $1,00 | 84,72% | $13,23 | 30,23% |
| Intel | INTC | 2,26 | 4,97 | $0,45 | $0,22 | 48,38% | $2,00 | 44,00% |
| Coca-Cola | KO | 3 | 4,43 | $0,68 | $0,28 | 41,35% | $1,89 | 59,26% |
| McDonald’s | MCD | 1,246 | 1 | $1,25 | $0,77 | 61,80% | $5,39 | 57,14% |
| Apple | AAPL | 20,97 | 0,94 | $22,31 | $3,05 | 13,67% | $41,89 | 29,12% |
All payouts then make a lot more sense and I can have the feeling that my stocks will continue paying dividend. However, there are some big differences for Chevron (who shows a FCF payout over 80% while a EPS payout of 30%) and Johnson & Johnson (FCF at 45% and EPS payout at 72%).
So Is The Dividend Payout Ratio That Bogus? Should You Use The FCF Instead?
In the light of my research, I can say that I will continue using the dividend payout ratio. I find the FCF hard to use for two reasons. The first one is that I can’t get the FCF payout calculated automatically, I have to do it myself. This adds-up to the time I spend checking on a stock. The second is that the FCF varies greatly from quarter to quarter so an average would be necessary to establish the “right” number to use.
On the other hand, the dividend payout ratio shows its flaws as well. However, neither the FCF nor the classical way of calculating should be the only metric you look at. I strongly believe that one investor should have their sets of rules to invest and many metrics should be taken into consideration.
For example, I’m using the following metrics (cited and explained thoroughly in my book: Dividend Growth; Freedom Through Passive Income):
- Dividend yield over 3%
- 5 year dividend growth positive
- Dividend payout ratio under 75%
- Return on equity (ROE) over 10%
- 5 year annual income growth rate positive
- Current price / earnings ratio (PE) under 20
Considering the overall strategy, the choice of one metric over another makes it obsolete. I think that if you have a sound investing strategy and look at several metrics before making your decision, the choice of using Free Cash Flow or the classic dividend payout ratio calculation won’t make a difference. After all, it is true that accounting can twist the number to make earnings look better, but this only works for a while. By looking at 5 and 10 year metrics, there is nothing accountants can hide from you anymore!
Readers, what do you use? Payout ratio or Free Cash Flow?
disclaimer: I own all stocks mentioned in this article (JNJ, KO, INTC, AAPL, CVX, MCD)
The post What if The Dividend Payout Ratio Was Bogus? How About Using Free Cash Flow? appeared first on The Dividend Guy Blog.