Last week, I wrote an article in reaction to some fascinating email correspondence with Ron, my reader focusing more on dividend yield than dividend growth. He even provided very solid point throughout our discussion. When I wrote my latest article, I modified his charts as I believe it was incorrect. The chart that was supposed to be seen in the previous post was even more shocking:
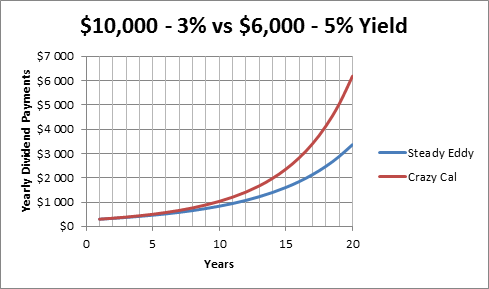
You see it right, in the original story, Crazy Cal with its small $6,000 generates more income from its portfolio than Steady Eddy with its solid $10,000 portfolio. How can this be possible? Here’s the answer from Ron:
Hello again Mike,
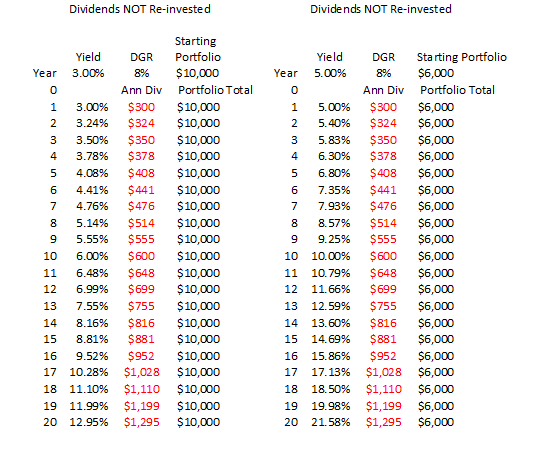
Well I think I know where the confusion lies. In virtually all of my scenarios and calculations I always reinvest the dividends that allow the “magic” of compounding to occur. For my personal purposes I always compare securities using an analysis of ~ 10 years of DRIPing dividends followed by ~10 years of taking dividends. That is why there is always a little “bend” in my 20 year dividend curves at the 10 year mark. However, in the little story I provided for you I assumed reinvesting for the full 20 years, since that is what perhaps most DRIP investors want to evaluate. For the dividend curves to remain on top of each other in my story, the dividends would have to be NOT re-invested. So yes, you are absolutely right, if the dividends are taken (i.e., not reinvested), then the yearly dividends remain identical as shown in the chart below: The red column is most important.
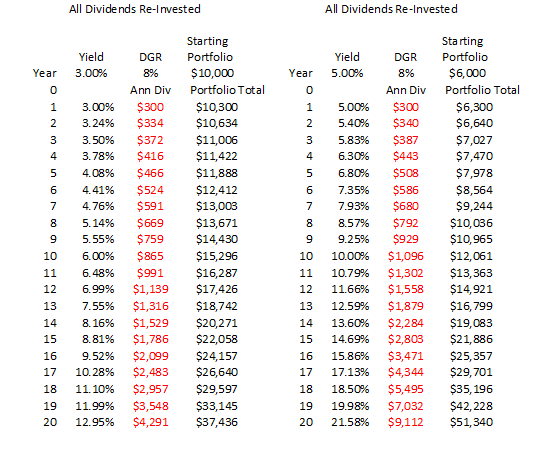
But, my story says that both Crazy Cal and Steady Eddy will reinvest all dividends. With the power of compounding a curious thing begins in the 2nd year as shown in the chart below. The red column is what is plotted on charts.
I am sure that all of this is pretty obvious to you. As you know, dividend investors have different strategies and some are DRIPers and some are pure income guys. My story assumed DRIPing for all 20 years. I hope this solves the mystery.
You may notice a slight discrepancy between the above charts and the graph shown in my story, most easily seen at the end years. The reason for this is the graphs in my story assume a stock price appreciation of 2% per year. A number or percentage I often use just to be conservative. In my charts above however, I do not factor any stock price appreciation into the chart. As you know, if the underlying stock price remains the same (no growth), relatively more shares can be purchased with each dividend reinvestment, so the compounding increases at a faster rate.
Of course, I choose the yields and portfolio values in my little story so that they would be equal in the first year. Curiously, if I had used a DGR of 6% for Crazy Cal’s portfolio, then the two curves would be identical (on top of each other) even for reinvesting all dividends for all 20 years.
However, the purpose of my story was not to compare DGRs, but to suggest that taking on some or more risk (vis-à-vis reasonably higher initial yields) may not always be a bad thing to do, even if catastrophic events can occur. From my personal analysis and research so far, it seems clear to me that for shorter term investors (less than 20 years) the relative importance one assigns to yield versus dividend growth rate should be different than for longer term investors (greater than 20 years). I have done hundreds one-on-one real life comparisons pitting lower yield-high DGR versus higher yield-low DGR stocks and find that most often the lower yield-high DGR stocks only achieve greater yearly dividends after 13 to 19 years, and almost never equal the cumulative distributions within a 20 year time period. Of course, I am not talking about absurdly high yields. I almost never consider yields over 10%. However, I often consider 6-8% yields with very low or 0 % growth rates. In the < 20 year time period, these dividend producing investments can and do out-perform “normally recommended” dividend securities on a regular basis.
Although I am a relatively unsophisticated newbie regarding dividend investing, I do get a little amused when I read about 15-20% and sometimes higher DGRs for 5 years etc., to me at least, incredulous expectations or assumptions these growth rates will somehow be maintained for long periods of time. Based on what evidence? I cannot find much, if any. In fact, there is more historical evidence to the contrary. Common sense (and observations) would also seem to indicate that quality companies will always reduce their DGR to almost zero before resorting to actually cutting their dividends. Cutting DGRs results in little market reaction compared to dividend cuts. I feel a little embarrassed to admit it, but sometimes I actually have more confidence and a better feeling about companies that have historically low DGRs because I have more confidence it can be maintained and the dividend itself will not be cut. If that investment meets my investment strategy (dividend returns for 10 years, say), then I am not too concerned about very long term superior performance brought by high DGRs. Why, because I will probably not be around to enjoy it, or in 20 years my investment strategy will likely be different.
Ron
Further Thoughts from my perspective
In all honesty, I’m shocked to see how the distributions grew a lot bigger with a smaller portfolio but a stronger dividend yield. I know it’s only a theoretical approach, but still, I didn’t expect such an outcome. Did you?
I did a quick filter to see how it was possible to find companies paying 5%+ yield and still keep up an 8% dividend growth rate for a long period. I’ve filtered the companies who were able to keep this pace for the past 5 and 10 years. I was surprised to find 72 companies. Then, I did the same filter research for companies between 3% and 5%. I found 119 companies. I guess it’s fair to say that you have almost twice the universe to pick a company paying 3% yield and assure a strong dividend growth rate overtime. A very interesting find was also the total return of these companies (stock value + yield) after 7 years:
The average in the high yield group is 109.70% and the average return for the 3%-5% group is 153.27%.
12 companies (or 16.67% of the group) in the high yield group show a negative return after 7 years for an average negative return of -36.85%.
9 companies (or 7.56% of the group) in the low yield group show a negative return after 7 years for an average negative return of -29.28%.
You can download both lists here:
High yield stocks
3-5% yield stocks
Lists have been provided by Dividend Stocks Rock.
Overall, what this research taught me was that #1 it is possible to build a high yield portfolio that will outperform a low yield over 10-20 years but also #2 picking among higher yielding stocks limit your stock universe and greatly increases the chances of picking a loser.
Are you surprised about the outcome of this research?