Back in 2012, I did a Procter & Gamble (PG) analysis. At that time, I concluded this was a great dividend stocks but there wasn’t much space for future growth to a relatively high P/E ratio and additional pressures on margins. It seems I was dead wrong:

The company went through a tougher period after my analysis (at least, I’m not a complete fool! Hahaha!) but took actions and it is now on the roll. You can see on the following graph that EPS went down on 2013 but kicked back up rapidly. This explain how the stock reacted over the past 18 months:

It seems their $10Billion productivity plan announced in February 2012 worked well as their EPS increased faster than their sales. Still metrics look better today than they were not so long ago. Following the first 4 investing principles, I’ll take a second look at Procter & Gamble.
Principle #1 High Dividend Yield Doesn’t Equal High Returns
Did you know that the highest dividend yield stocks underperform more “reasonable” yielding stocks? The Hartford Mutual Funds company wrote:
The study found that stocks offering the highest level of dividend payouts have not performed as well as those that pay high, but not the very highest, levels of dividends.”

While PG dividend payouts keep increasing year after year, its dividend yield remain in the “more reasonable” range. It is currently around 3%.

Considering the stock price went up significantly during the past two years, the dividend yield has dropped from 3.50% to 3.00% simply because shares went up faster than the dividend payout.
Principle #2: If There is One Metric; It’s Called Dividend Growth
If I had to go blindfold to pick a stock and have only one metric to look at, I would pick dividend growth. This is the most important metrics to me as it is a clear sign of the company’s financial health and its ability to pay me for years to come. Here’s an interesting quote from Saturna Capital:
“Indeed, dividend growth has been a much larger determinant of equity returns in this new era of low benchmark rates and higher levels of uncertainty.”

When we talk about dividend growth, we can definitely put PG on a podium. The company has been increasing its dividend for 58 consecutive years. The payout increased by 153% in the past 10 years. As you can see in the graph below, the growth is not only impressive, but it is also very stable and predictable. This is something I really like as a dividend investor:

There are absolutely no worry about the management will to increase dividend in the future either.
Principle #3: A Dividend Payment Today is Good, A Dividend Guaranteed For the Next 10 Years is Better
It is one thing to look at the company’s past, but the 58 consecutive years of increasing dividend doesn’t mean much if the company won’t be able to keep it up for another 10 years or more. PG dividend history is very impressive, but there is more. The company could have decided to aggressively increase its dividend and jeopardize its long term ability to sustain it. This is why it is also important to look at the payout ratio. Since 2010, the payout ratio increased but not dramatically. It is still very showing a very reasonable rate of 45%.

This means the company has adopted a sustainable model for raising its dividend and won’t jeopardize the company’s future since there is more than sufficient money to pay investors.
Principle #4: The Foundation of Dividend Growth Stocks Lies in its Business Model
A company that doesn’t have a sound business model won’t be able to sustain consecutive dividend increase over the long haul. On the other side, businesses which pay dividends and increase them will outperform other stocks:
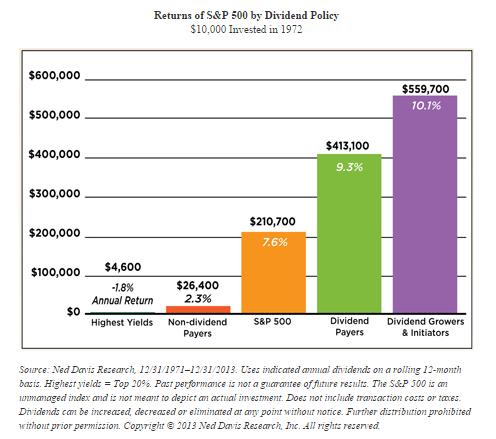
Source: Edward D. Jones – Dividend Stocks Rock
Now how can you find these marvels? This is why you need other financial metrics to identify companies that will be able to sustain and increase their dividend for the next 10 years. At DSR, we look at the 3 and 5 year metrics for Sales and Earnings per Share (EPS) growth. We only select companies showing positive growth on both the 3 and 5 year periods. Since an economic cycle lasts between 5 and 8 years, a strong company should be able to post increasing sales and earnings over these periods. Here’s what PG metrics looks like:
DSR STOCK METRICS
3 year revenues = 0.80% Pass
5 year revenues = 1.61% Pass
3 year EPS growth = 0.67% Pass
5 year EPS growth = -1.20% Fail
Procter & Gamble passes 3 of the 4 test. It fails the 5 years EPS growth mainly to margin pressures experienced in 2012 (go back to the second graph of this article). But the company has taken control of its expenses and bounced back rapidly. The key here is not to stop at the metrics but to look further. As you can see, the growth for both revenues and EPS are not phenomenal, far from it. But it’s normal; Procter & Gamble is not a techno stock with a great innovation. It is one of the largest and best known companies in the world. PG operates in over 180 countries and they have divided their widely diversified operations into 5 divisions:
Beauty (Head & Shoulders, Olay, Dolce & Gabbana, Gucci & Hugo Boss fragrance)
Grooming (Braun, Gillette)
Health Care (Always, Crest, Oral-B, Vicks)
Fabric Care & Home Care (Dawn, Duracell, Febreze, Gain, Iams, Tide)
Baby Care & Family Care (Bounty, Charmin, Pampers)
You can’t obviously expect a huge growth from such company in the consumer products. However, it is definitely one of the strongest stocks to build a core portfolio. Now… the question that kills; is Procter & Gamble too expensive right now? This brings me to my 5th investing principle:
Principle #5 Buy When You Have Money in Hand
I personally go with this moto: once you have selected the right stock, the right moment to buy it is now, time will do the rest.
You can read the full explanation why here.
Principles #1 to #4 cover how to find the right companies. Once you have found them, the sooner you buy the stock, the sooner you start cashing its dividend. I wrote PG was too expensive at a P/E of 19 back in 2012 (mind you, the market was trading around 14 at that time). But the stock bounced back and now trades around 21.5… is it too expensive? Not if you look the 10 years history:
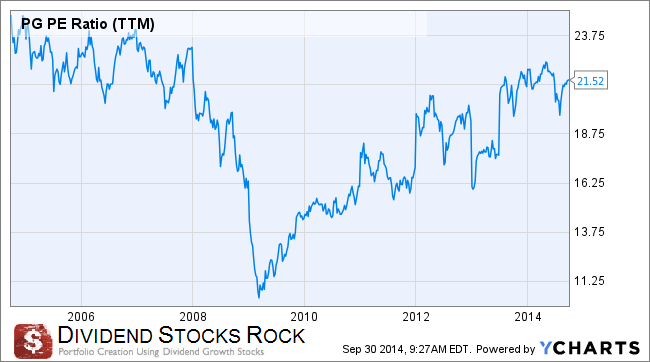
It is definitely not cheap, but how long will you have to wait before PG hits a 18-19 multiple? It’s easy to play Monday morning quarterback but I rather buy the stock when I identify it is a strong dividend growth stock based on my investing principle and move forward.
Most Recent Quarter Update – Still Unsure to Buy it…
Procter & Gamble biggest news in their latest quarterly report was definitely its plan to exit its Duracell personal power business by making it a stand alone company. PG’s EPS is down to $0.68 compared to $1.03 a year ago. However, excluding special items, PG’s EPS is in line with analysts’ estimates at $1.07. Sales were almost flat at $20.79 billion vs $20.83 billion a year ago (this is also what analysts expected). 2015 expectations remain the same with low single digit growth. There is no deal on PG right now, this is why PG is a HOLD and definitely not a buy.
Disclaimer: I don’t hold PG shares at the moment of writing this article but PG is part of our Dividend Stocks Rock Portfolios.