In September of 2017, I received slightly over $100K from my former employer which represented the commuted value of my pension plan. I decided to invest 100% of this money in dividend growth stocks.
Each month, I publish my results on those investments. I don’t do this to brag. I do this to show my readers that it is possible to build a lasting portfolio during all sorts of market conditions. Some months we might appear to underperform, but you must trust the process over the long term to evaluate our performance more accurately.
Performance in Review
Let’s start with the numbers as of March 4th, 2022 (before the bell):
Original amount invested in September 2017 (no additional capital added): $108,760.02.
- Portfolio value: $208,983.09
- Dividends paid: $4,176.48 (TTM)
- Average yield: 2.00%
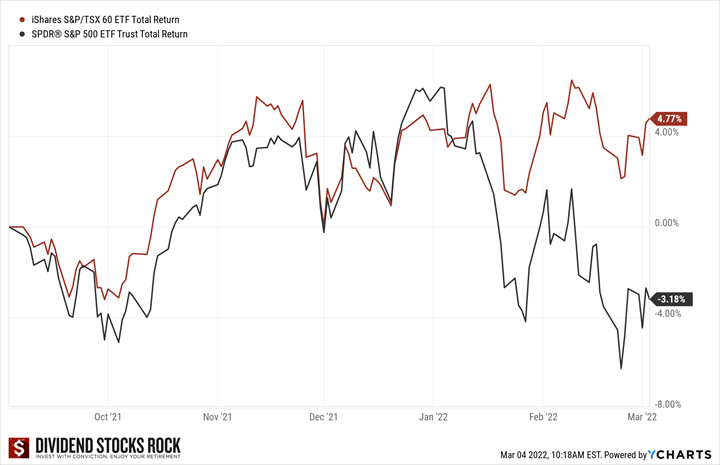
- 2021 performance: +16.78%
- SPY= 28.75%, XIU.TO = 28.05%
- Dividend growth: +3.14%
Total return since inception (Sep 2017- Feb 2022): 92.15%
Annualized return (since September 2017 – 53 months): 15.94%
SPDR® S&P 500 ETF Trust (SPY) annualized return (since Sept 2017): 15.70% (total return 90.43%)
iShares S&P/TSX 60 ETF (XIU.TO) annualized return (since Sept 2017): 12.07% (total return 65.44%)
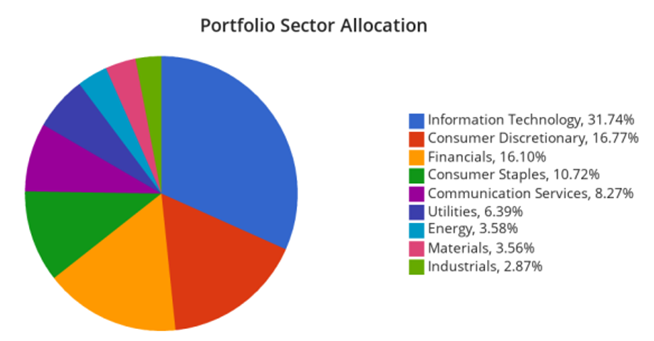
Sector allocation calculated by DSR PRO
Market Correction?
To be fair, I’m writing this newsletter on a beautiful Friday morning, March 4th. The market is down again this morning, but I don’t care because my coffee is bringing my morale way up. Over the past two years, we have read so many fear mongers telling you the real correction was about to happen. Well, it looks like the pandemic wasn’t enough to bring the stock market to its knees, but the major conflict happening between Russia and Ukraine brings its load of uncertainties. If there is one thing the stock market hates, it is uncertainties. When you think about it, the market is a voting machine trying to figure out the future price of all stocks with today’s information. It’s hard to predict the future in the middle of a war. Hence, the volatility we have today. However, it’s not that bad:
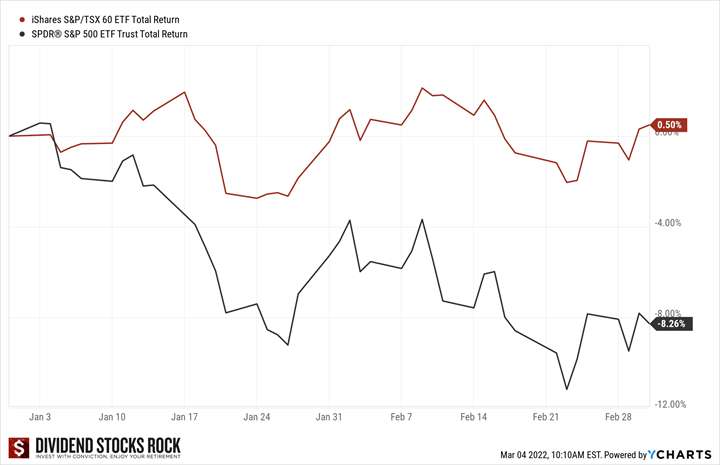
Since the beginning of the year, only the NASDAQ (consisting of mostly tech stocks) is in market correction territory. A correction is defined as a drop of at least 10% in value from its peak level. The S&P 500 reached that level but seems to resist. As for our fellow Canadians, they can count on basic materials and the energy sectors to compensate for the fall of beloved stocks like Shopify (SHOP) and Lightspeed (LSPD).
What really stings though is that we have been living in a “no returns” land since September. This is 6 months where we didn’t generate much from our portfolios (except for dividends of course).
When you consider that we have been enjoying annualized double-digit returns since 2009, to have 180 days without making a penny seems like crossing the Sahara. What many seem to forget is what we are living now is only normal. We will go through periods where it’s hard to generate significant returns and sticking to your strategy will be key.
As you know, I am a runner. My goal this year is to run 1,200km for an average of 100km per month. This seems like a lot, but if you are committed to run 4 times a week, this comes down to running between 6km and 7km each time. I live in Quebec, where winters are harsh. This year, I had to run in temperatures below -25 Celsius (-13°F) several times in January and February. Those runs are obviously not my favorites. The wind hit my face like a baseball bat while I end my morning not feeling my toes. However, I know that if I get up every other day and go for my run, I’ll go through this challenging period and end up running faster during spring when the sun will warm up my face and give me the vitamin D I’m craving.
Do You Need Protection?
As investors, we are currently going through a winter period across the market. It’s time to focus on the little things. It’s time to focus on the process and not the results. Here’s an excerpt from one of my favorite books, Atomic Habits by James Clear:
“The goal in any sport is to finish with the best score, but it would be ridiculous to spend the whole game staring at the scoreboard. The only way to actually win is to get better each day. In the words of three-time Super Bowl winner Bill Walsh, “The score takes care of itself.” The same is true for other areas of life. If you want better results, then forget about setting goals. Focus on your system instead.”
Many of you have emailed me over the past weeks. There were a lot of questions directed towards portfolio protection.
Will we have a bank run now that Canadian banks can freeze our assets? Will Russia start a nuclear war? Will interest rates destroy our economy?
To protect their portfolios, some investors will go into cash or invest in bonds or gold. They will wait. What you do when you use those “protections” is that you protect your portfolio against volatility. There is nothing volatile about cash or bonds. When the market gets nervous, having gold in a portfolio will reduce volatility accordingly.
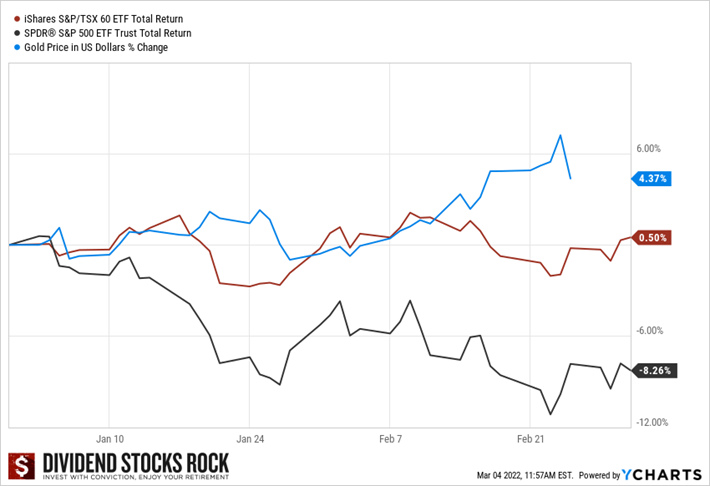
However, by reducing the volatility of your portfolio, you also reduce its total return potential over the long run. Therefore, you protect your money over the short-term by putting your long-term portfolio growth potential at risk. Now, there is nothing wrong with doing so if you can’t stomach fluctuations. This is part of a sound asset allocation according to your risk tolerance.
Where investors often make a big mistake is when they allow their risk tolerance to change according to market events. During a bull market, you may be fearless and increase your exposure to growth assets. During bear markets, you may become fearful and move your money towards stable and “protective” assets.
You get in the bull market late and don’t profit from its full strength. Then, you suffer from a small loss to move your money toward “no growth” assets to stabilize your portfolio.
Such trades will harm your portfolio because you will “always be late”. If you worry about Russia now, you should have built a portfolio that could weather that storm years ago. My answer was the same when I discussed the pandemic, the oil bust of 2014-2015 and the financial crisis of 2008.
In general, I’d say that the best protection is an asset allocation that meets your investment goals and your risk tolerance. If you don’t feel you can stomach the current market fluctuations, this means you overestimated your risk tolerance. If you decide to decrease your growth assets for more stability, that’s good if you keep that new asset allocation going forward. This means keeping it also when the market goes back into full-growth mode.
Let’s look at my CDN portfolio. Numbers are as of March 4th, 2022 (before the bell):
Canadian Portfolio (CAD)
| Company Name | Ticker | Market Value |
| Algonquin Power & Utilities | AQN.TO | 6,268.11 |
| Alimentation Couche-Tard | ATD.B.TO | 17,328.93 |
| Andrew Peller | ADW.A.TO | 4,230.92 |
| National Bank | NA.TO | 12,116.94 |
| Royal Bank | RY.TO | 8,342.40 |
| Brookfield Renewable | BEPC.TO | 2,010.96 |
| CAE | CAE.TO | 6,912.00 |
| Enbridge | ENB.TO | 9,069.13 |
| Fortis | FTS.TO | 5,866.74 |
| Intertape Polymer | ITP.TO | 7,026.00 |
| Magna International | MG.TO | 5,904.50 |
| Sylogist | SYZ.TO | 4,115.79 |
| Cash | 560.97 | |
| Total | $89,753.39 |
My account shows a variation of -$4,241.17 (-4.5%) since the last income report on February 4th. Showing a portfolio down by almost 5% in a month is usually not a good thing. However, when I look at the company’s quarterly performance, I can see that the market doesn’t know how to read numbers (what else is new, right?).
Algonquin Power & Utilities reports double-digit growth
AQN isn’t the flavor of the month (or the year), but the utility company is showing that it can grow via acquisitions once again. Revenue was up 21% for the quarter and 36% for the year. While adjusted EPS was flat for the quarter (results were affected by weaker weather conditions), AQN ended the year with EPS up 11%. For 2022, AQN expects EPS to be in the range of $0.72-$0.77 (+1.4% to +8.5%). At worst, this would bring the payout ratio to 95%. This would not be ideal, but this tells me that my payments are safe while the company continues its $12B CAPEX plan through 2026.
Andrew Peller has disappointed me for the last time
It stings but I have no other choice. I added Andrew Peller to my portfolio in 2017 as I saw a dominating company that would continue to grow revenues by acquisition. They were a company that should use its network distribution and economies of scale to generate higher profits year after year. What do I have now? A company that kept the “dream alive” as it increased its dividend generously over the past few years but failed miserably to generate any growth. This quarter, revenue was down 6%. What was management’s excuse? The pandemic cannot be an excuse forever. I’m selling my shares in March!
National Bank is amazing (tell me something I don’t know!)
Another quarter and another success for National Bank! The Bank reported double-digit growth in EPS (+23%) and net income (+22%). Net income for PC totalled $317M (+27%), strong growth that was essentially driven by an increase in total revenues and lower provisions for credit losses. Wealth Management reported net income of $176M which was up 11%. Financial markets net income of $307M was up 20% mostly due to higher total revenues and lower provisions for credit losses. U.S. specialty and Intl net income of $148M was up 9% due to higher total revenues combined with lower non-interest expenses.
Royal Bank put another strong quarter in the books
Royal Bank reported a good quarter with EPS and net income up mid-single digits. Personal & commercial banking, the lender’s largest segment, net income fell 3% to C$1.97B and rose 10% from a year ago, primarily due to higher non-interest income which included higher mutual fund distribution fees as equity markets and strong net sales drove higher average balances. Strong results came from Wealth Management with net income up 42% vs last quarter and up 24% vs last year. Q1 capital markets net income jumped 12% from the previous quarter and fell 3% from the year-ago period. This should be a good year for the king of banks!
Brookfield Renewable is loyal to its shareholders
BEPC recently reported its latest earnings. The company reported double-digit growth for FFO per unit (+11%) and revenue (+15%). Strong results were supported by organic growth, inflation-linked contracts, and acquisitions. In 2021, BEPC agreed to invest approximately $4.3B across various transactions in every major market and technology in which they operate. The goal was diversification with their first investment in offshore wind and the expansion of their hydroelectric and battery storage portfolios. To sweeten the deal, management announced a 5% dividend increase!
CAE is still facing challenges
CAE reported a good quarter, but the company is not out of the woods yet. Civil Aviation Training Solutions revenue was down 5%, but CAE noted a 10% increase in Civil training center utilization to 60%. The Civil book-to-sales ratio was 1.93x for the quarter and 1.20x for the last 12 months. The Civil backlog at the end of the quarter was $4.6B. Defense revenues were $426.5M which was up 42% compared to the third quarter last year, which includes $127.9M from L3Harris Technologies’ Military Training business. The Defense book-to-sales ratio was 1.39x for the quarter and 1.05x for the last 12 months. Management didn’t mention anything about the dividend.
Enbridge remains a solid dividend payer
On Feb 15, 2022 Enbridge reported distributable cash flow (DCF) of $10B or $4.96/share, compared with $9.4B or $4.67/share in 2020. The company increased its dividend by 3% to $0.86/share. It reaffirmed the 2022 full-year guidance range for EBITDA of $15B to $15.6B and DCF per share of $5.20 to $5.50. This means the DCF payout ratio should be between 62.5% and 66% for 2022. Enbridge is one of the rare high-yielding stock offerings with constant dividend increases and a safe payout ratio. ENB also completed the $1.1B sales of Enbridge’s interest in Noverco Inc. providing for additional financial flexibility. ENB said it transported slightly more than 3M bbl/day on its Mainline system in Q4.
Fortis is boring and I like it this way!
FTS reported annual net earnings of $1,231 million, or $2.61 per common share in 2021, compared to $1,209 million, or $2.60 per common share for 2020. For the fourth quarter of 2021, Net Earnings were $328 million, or $0.69 per common share, compared to $331 million or $0.71 per common share for the same period in 2020. Results for the quarter reflected a reduction in sales due to milder weather and lower investment gains in Arizona, the timing of earnings at FortisAlberta, and higher non-recoverable costs at Central Hudson and ITC.
Magna International isn’t done with chain supply disruption
Magna International reported sales of $9.1B in Q4 2021 which is a decrease of 14% from Q4 2020. By contrast, global light vehicle production decreased 17% in Q4, reflecting decreases of 20% in North America, 28% in Europe, and 10% in China. The lower light vehicle production was driven by the semiconductor chip shortages the industry has faced throughout 2021. Adjusted EBIT decreased to $508M in Q4 2021 compared to $1.1B in Q4 2020. This decrease mainly reflects lower margins earned on reduced sales, labor and other operational inefficiencies at their facilities as a result of unpredictable customer production schedules due to semiconductor chip shortages and other constraints.
Sylogist is looking good (if you are patient and don’t mind volatility)
Get ready for a lot of growth in the coming years. Sylogist increased its credit facility to $125M and the new CEO is building a strong pipeline of acquisitions to come. This may come at the expense of the dividend growth policy though. Revenue jumped 32% while recurring revenues from subscriptions and maintenance grew by 25%. SYZ recorded key contract wins in Q1 of $5.9M, which form a strong basis for ongoing organic growth. EPS was down 29% as R&D expenses surged 450%. SYZ also hired several account executives and sales engineers. Their results were also affected by delays in deployments of SYZ’s contracted bookings and upgrades due to the COVID-19 Omicron variant surge.
Intertape Polymer Exploded! (208 PRO members celebrate with me!)
Intertape Polymer (ITP.TO) stock surged on March 8th on a big announcement: it will be acquired at $40.50 per share! (Congrats to all 208 DSR PRO members who have ITP in their portfolio)
Read more here.
As you know already, I have this beauty in my portfolio. Since the stock went up above $39 and the transaction is expected to close in Q3, I will not wait until then to make an extra buck on the trade (+ potential dividend). I placed a sell order the next day and bought Granite REIT (GRT.UN.TO) with the proceeds (more on that in the next portfolio update!).
My portfolio will be updated accordingly for my March update (since all numbers were taken as of March 4th).
Here’s my US portfolio now. Numbers are as March 4th, 2022 (before the bell):
U.S. Portfolio (USD)
| Company Name | Ticker | Market Value |
| Activision Blizzard | ATVI | 9,454.00 |
| Apple | AAPL | 12,467.25 |
| BlackRock | BLK | 10,327.94 |
| Disney | DIS | 6,550.65 |
| Gentex | GNTX | 6,906.65 |
| Microsoft | MSFT | 16,275.60 |
| Starbucks | SBUX | 7,780.05 |
| Texas Instruments | TXN | 8,550.00 |
| VF Corporation | VFC | 4,551.39 |
| Visa | V | 10,361.50 |
| Cash | 163.58 | |
| Total | $93,388.61 |
The US total value account shows a variation of -$3,380.01 (-3.5%) since the last income report on February 4th. I’ve already done a good review of all my stocks last month. I only had Disney left on my list:
Disney reported Q4 2021 EPS increased to $0.63 from $0.02 in the prior-year quarter. The average monthly revenue per paid subscriber for domestic Disney+ increased from $5.80 to $6.68 due to an increase in retail pricing and a lower mix of wholesale subscribers, partially offset by a higher mix of subscribers to the SVOD Bundle. Content Sales/Licensing and Other revenues for the quarter increased 43% to $2.4 billion and segment operating results decreased from income of $188 million to a loss of $98 million. Disney Parks, Experiences and Products revenues for the quarter increased to $7.2 billion compared to $3.6 billion in the prior-year quarter.
My Entire Portfolio Updated for Q4 2021
Each quarter, we run an exclusive report for Dividend Stocks Rock (DSR) members who subscribe to our very special additional service called DSR PRO. The PRO report includes a summary of each company’s earnings report for the period. We have been doing this for an entire year now and I wanted to share my own DSR PRO report for this portfolio. You can download the full PDF showing all the information about all my holdings. Results have been updated as of January 2022.
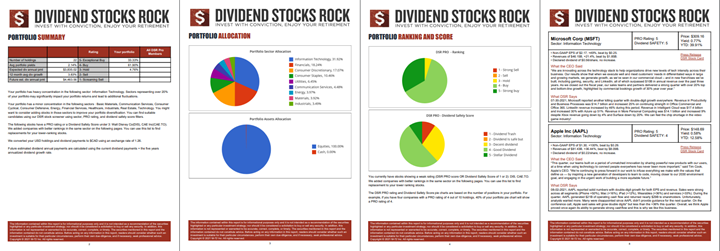
Download my portfolio Q4 2021 report.
Dividend Income: $289.25 CAD (+11% vs February 2021)
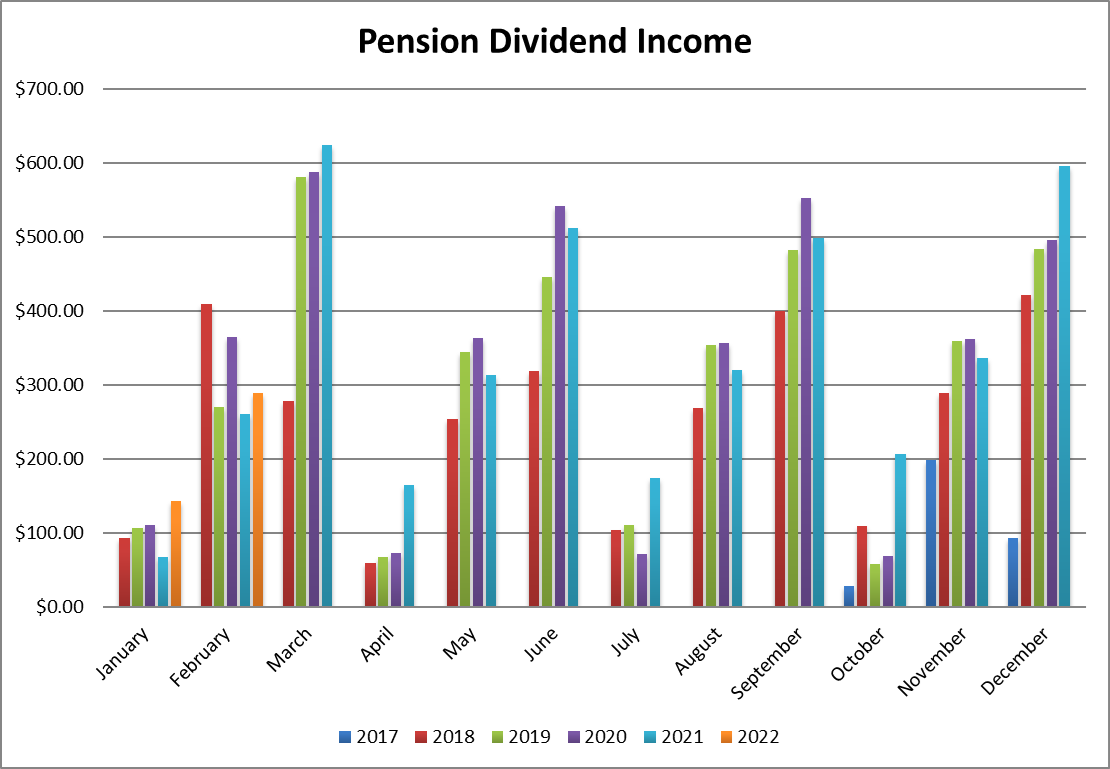
We had a solid performance this month with dividend payments up 11%. I show 3 double-digit dividend growers this quarter from National Bank, Royal Bank and Texas Instruments. While I didn’t receive dividends from Hasbro this year because I sold my shares in 2021, I did receive my Starbucks payment earlier (was paid in March of 2021).
Overall, it was a good month of dividends where each company showed a higher dividend per share vs last year. When the market goes sideways, this is usually the place where I get my confidence back!
Here’s the detail of my dividend payments.
Dividend growth (over the past 12 months):
- National Bank: +22.54%
- Royal Bank: +11.11%
- Texas Instruments: +12.75%
- Apple: -16% (I trimmed my AAPL position)
- Starbucks: +8.9% (was paid in March 2021)
- Currency factor: +1%
Canadian Holding payouts: $141.60 CAD
- National Bank: $69.60
- Royal Bank: $72.00
U.S. Holding payouts: $115.65 USD
- Texas Instruments: $57.50
- Apple: $16.50
- Starbucks: $41.65
Total payouts: $289.25 CAD
*I used a USD/CAD conversion rate of 1.2767
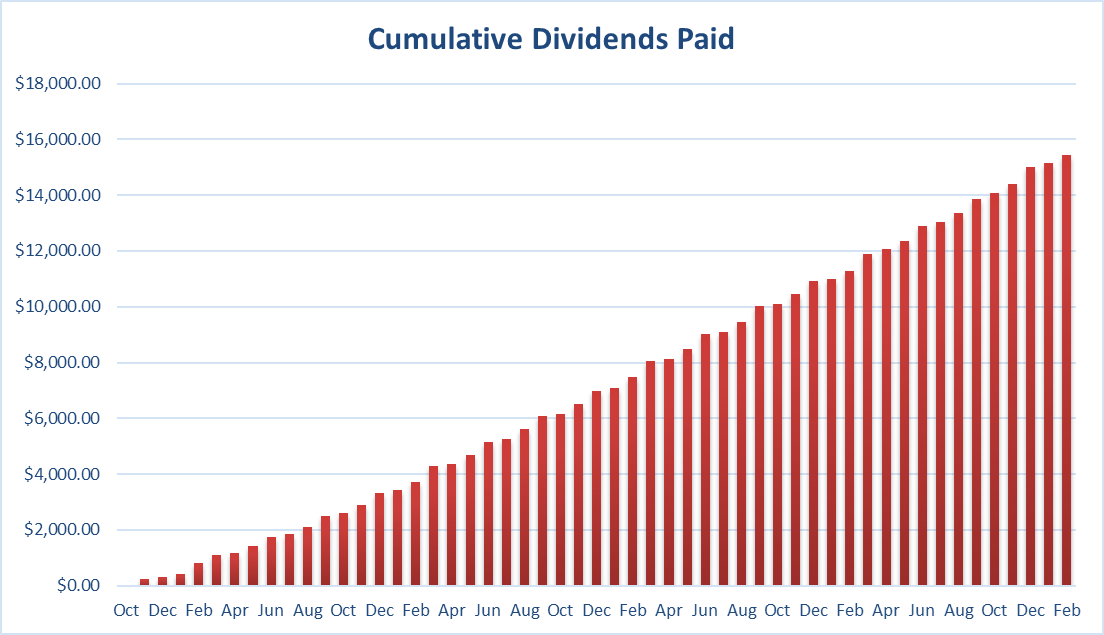
Since I started this portfolio in September 2017, I have received a total of $15,442.09 CAD in dividends. Keep in mind that this is a “pure dividend growth portfolio” as no capital can be added into this account other than retained and/or reinvested dividends. Therefore, all dividend growth is coming from the stocks and not from any additional capital being added to the account.
Final Thoughts
As I mentioned earlier in my earnings review, I’m done waiting for Andrew Peller. I will sell my shares in March and complete my position in Brookfield Renewable (BEPC.TO) with the proceeds. This will bring my investment in Brookfield Renewable to a full position (about 3.33% of my pension plan portfolio). You’ll get the full detail in my April update!
Cheers,
Mike.
The post Market Correction Territory – February Dividend Income Report appeared first on The Dividend Guy Blog.