On Tuesday, I explained how I intend to grow a 192K portfolio into 1 million before I retire. After over a decade spent in working, researching and investing in the stock market, I feel well confident that I can make it happen. A fellow blogger, Dividend Geek, pointed out a very interesting question:
How we use past data to predict future (without taking into account macroeconomic trend, e.g. AMZN) baffles me. While we picking dividend growers, are we not again relying on past data?

Past data… Already happened
We keep reading that past performances are not indicative of future results. We all know that (or should anyway!). We also know that even if Mattel (MAT) traded close to $50 between 2012 and 2013, it doesn’t mean the stock will ever go back to this level (it’s closed to $15 right now…). We also know that because a company was dominant in the 80’s or the 90’s, it doesn’t mean it will continue is domination past 2020. Then again, past performances are not indicative of future results. In this context, it’s a little bit ironic we keep using past metrics to justify today’s addition to our portfolio, isn’t?
We are convinced that by looking at what happened last year, last 5 years, last decade, we will find what will happen tomorrow. That we can discover trends that will pursue in the future. It is sometimes right, but most of the time we are wrong. We are wrong because there are so many things that are about to happen that we still don’t know yet. Who thought Amazon (AMZN) would go after the food industry 10 years ago? We all thought it was a nice way to upgrade bookstores… When I was 20, I couldn’t even understand the importance of having a cell phone (and this was only 16 years ago!). Imagine my surprise yesterday as I was really upset to have *only* 36% of my battery left once I was in my car and forgot my charging cord!
But since it’s impossible to know what will happen in the future, we continue using past data.
How I use past data
In my investment strategy, past data is used as a starting point. It’s a little bit like traveling. Before you leave, you must know at least your departing point. Over the years, I’ve learned that I could save a lot of time if I use specific metrics to create a list of candidates for my portfolio. Then again, if you are about to travel, you will save lots of time and you will make sure to pick a good destination according to your taste if you do some research before buying a plane ticket.
I’m not a big fan of spending years to build the “perfect” stock screener. The main reason I don’t think it’s not a good use of time is because a screener will not pick the right stock for me. There is a limit of what data analysis can do and human talents will be required at one point. For this reason, I keep my screener quite simple. I use the following metrics:
- Revenue growth
- Diluted EPS growth
- Dividend growth
This first screen is aim to maximize the power of the Dividend Triangle. It is far from being sufficient to pick any companies from this list, but it’s a very good starting point. In fact, this will give you a list of stocks that are doing well. I usually use a 5 year period and request that each metrics shows positive results. To give you an idea, this screener gives me a total of 755 results when I combine both U.S. and Canadian markets. I obviously don’t go through that many stocks before making my decision. Instead, I use some “present data” to get a smaller number of stocks:
- Dividend yield
- Payout ratio
- Cash payout ratio
As opposed to many, I can tolerate dividend yield below 2%. I still enjoy when the stock pays more than quarterly pennies, but I will not ignore great companies like Canadian National Railway (CNR.TO), Alimentation Couche-Tard (ATD.B.TO) on the Canadian market or Disney (DIS) and Starbucks (SBUX) on the U.S. markets.
While playing around with those 6 metrics, I usually get a list of 100-200 stocks to look at. I can then cut off the ones that barely make the cut (e.g. with growth metrics under 2%). I always put more emphasis on companies that shows strong dividend growth before I go any further.
Then the real work begins
Playing around with a stock screener makes you think investing is easy. You get access to so much metrics in so little time; it makes the research possibilities infinite. Well, that’s the problem. Using past data is only the first step. You haven’t done anything yet.
Once I select a company I’m interested in, I have to go deeper, I have to understand how the company operates. Understanding in what you invest your money is a golden rule we should all follow. How can you read a company’s financial statement and predict what will happen next if you can’t even explain what the company do to a 12-year old? I usually hit the company’s website, look for a fact sheet, or the “about us” section and then read the first pages of their latest annual reports. When you combine those things together, you usually get a good grasp of what the company does.
The next step is all about identifying trends and understanding them. A nice graph showing growing revenue doesn’t mean anything:
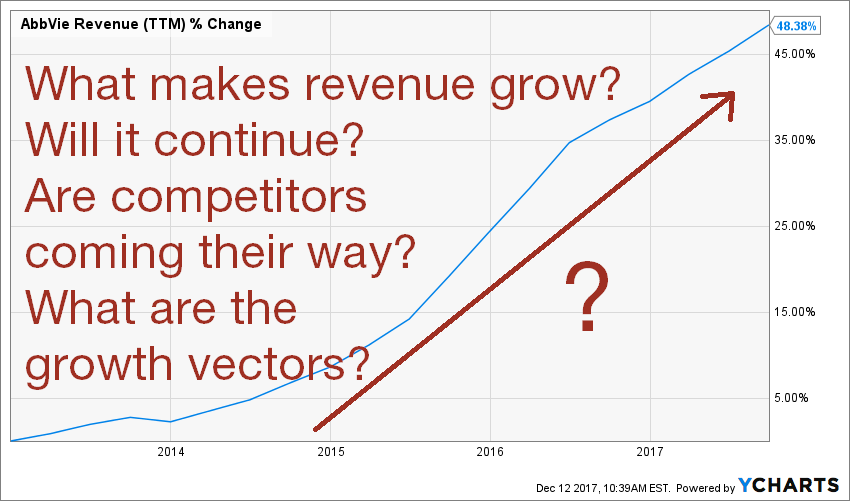
I often find explanations after hours of reading through quarterly earnings, investors’ presentations and reading other’s analysis. But this step is crucial to know what will happen next. If I can’t identify strong growth vectors that will propels the company higher, there is no point in buying. After all, I’m in this game for the long haul; I don’t want a juicy dividend now when I can get stock appreciation doubled with robust dividend growth for the next 20 years.
As you can see, past data is only the beginning
I don’t think we have a choice of using or not past data. If we can’t look at what a company has done in the past, it is hard to understand how it will react in the future. However, thinking that a company that has been increasing its dividend for the past 25+ years will continue forever isn’t a good premise. Almost each year, there are new aristocrats and old ones are getting kicked out for failing their shareholders. Then again, a company that has been dominant 10 years ago may very well miss the next train of evolution and becomes a loser in your portfolio.
If you rather have someone else doing the hard work for you, there is a solution
After reading my latest 2 articles about portfolio management, you may feel overwhelmed. Some will find it’s too much time and others will realize that investing isn’t that simple. If you fall in either category, I have a solution for you. Dividend Stocks Rock (DSR) has been offering research services since 2013. Our portfolios have outperformed their benchmark and investors receive live buy/sell trade alerts. If you are unsure about a company, you have the possibility to request a stock report done by our team. There are over 100 stock cards that are less than a year old and we add/review a minimum of 5 stock cards per week. You can check a stock card example here. DSR doesn’t offer buy/sell recommendations or advices, but we give you all the necessary information in an easily consumable and efficient way in. This is how you can stop struggling about the moment to sell your current holdings or what to buy next.
The post What is the Importance of Past Data in Your Investment Process? appeared first on The Dividend Guy Blog.