Investing new money in the stock market hasn’t been an easy task for the past 2 years. We ran into our first market dip in 2016, boiled by investors’ worries. Then, clouds disappeared and opened the space for more sun to shine over the stock market. This is how both markets finished 2016 with great strength:
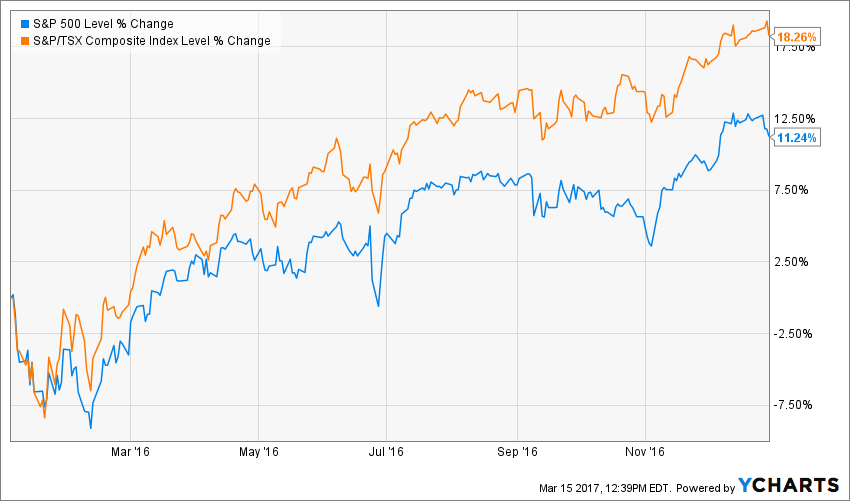
Source: ycharts – dividend excluded
While this is good news in the short term, investing in 2017 has been terribly difficult for most of us. Why? Because everything is pricey…
Everything is Pricey
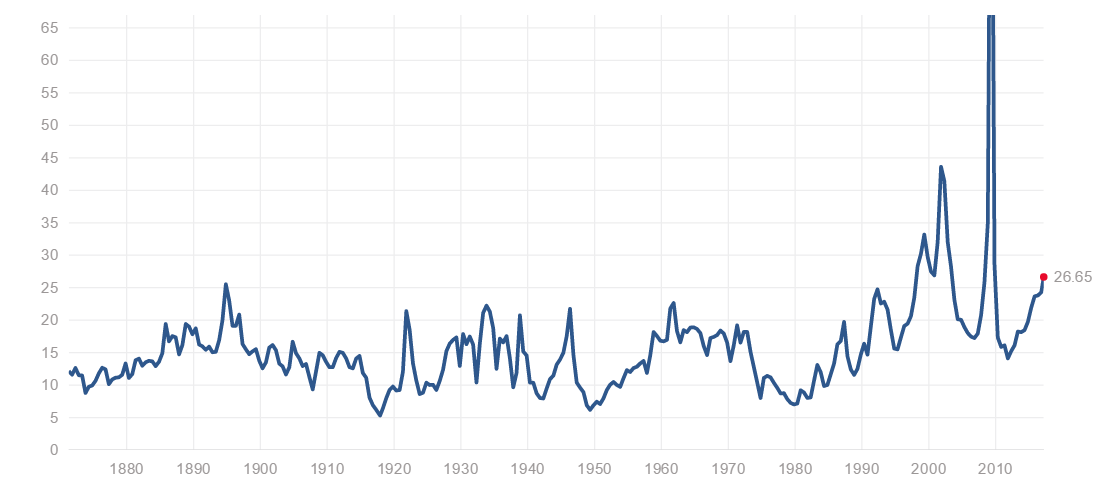
Source: http://www.multpl.com/
From time to time, I like to see what the average PE ratio of the S&P 500 looks like. It gives me an indication if the overall market is healthy or completely disconnected from reality. At the moment, I can only say it looks terribly disconnected…
Is this time to review your valuation model? How do you invest new money in such a stock market? These are the questions I’m trying to answer here…
10 Year PE Ratio History has its Flaws
In order to value any stocks, I start by using a simple technique: I ask what the market thinks of it. By looking at the past 10 year PE ratio history, it gives me an indication of how much the stock should trade at. Why using a 10-year scope? Because you are usually able to get a full stock market cycle including both full bull and bear markets. I’ve picked a few of my favorite holdings at the moment (all part of my DSR portfolios) to show you what this looks like:
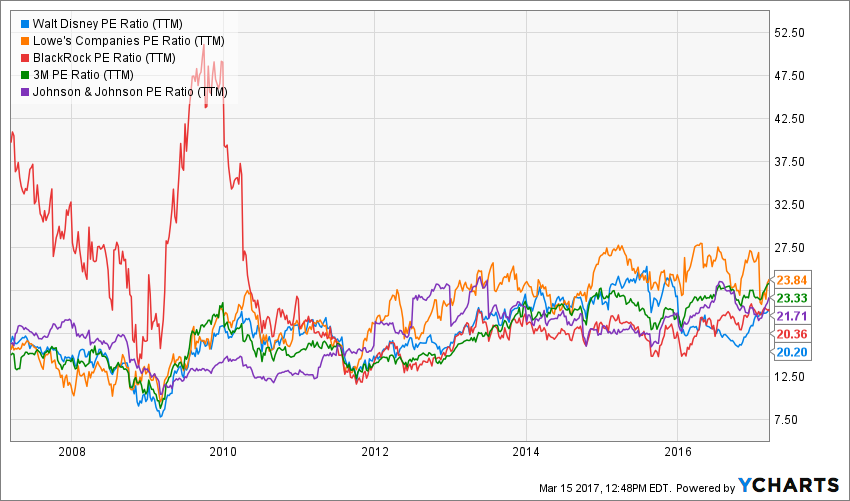
Source: ycharts
I didn’t cherry pick these companies; I just pulled them out of my current portfolios. They all seem quite overpriced when you look at their 2012 level compared at today’s. On the other hand, if I had pulled this graph in 2014, I would have come up with a similar conclusion on all of them as their valuation levels are quite the same. If I had decided not to invest in these companies in 2014, I would have made a big mistake:
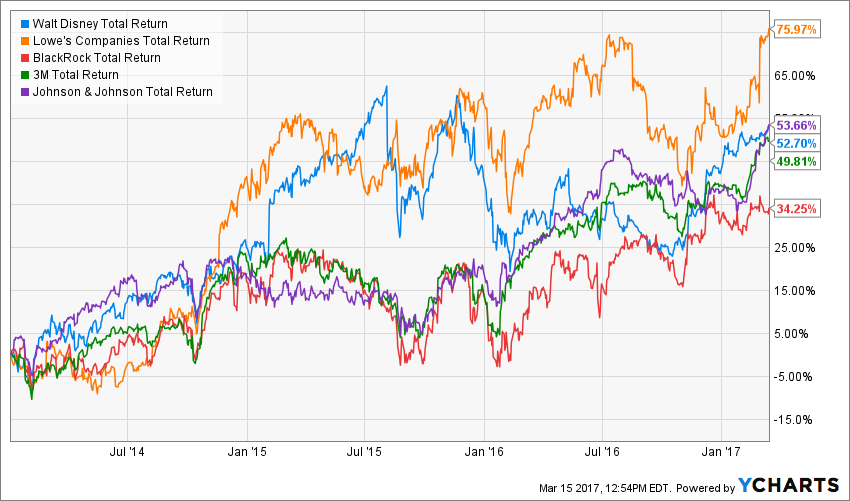
Source: Ycharts
These 5 companies averaged a total return of 53.28% over the past 3 years. As an investor, can you really afford to leave this kind of money on the table? I know I won’t. Therefore, using the 10 year PE history is a good start, but it is definitely not perfect.
For this reason, I always use a more technical approach to determine the value of each company’s shares.
How to Efficiently Apply the Dividend Discount Model (DDM)
My favorite tool to determine the value of a company is the Dividend Discount Model (DDM). I use a calculator with double stage dividend growth enabling me to use a 10 year dividend growth rate reflecting the company’s current situation and a terminal rate with a more conservative approach.
The idea of using the DDM is to value a stock with one thing in mind: its dividend growth potential. Since my goal is to invest in dividend stocks and the most important metric in my investing model is dividend growth, using the DDM makes total sense. In other words, you give a value to a money making machine by assessing the future value of its payments.
Discount Rate
The discount rate is the expected rate of return you want for each holding. I use various discount rates depending on the strength of the company analyzed. When a company is the undisputed leader in its industry, operates around the world and benefits from multiple and diversified streams of income, I will use a discount rate of 9%. A company like 3M Co (MMM) is so big that you can’t expect to grow as fast as Hasbro (HAS) which is currently on the fast track because of their recent deal with Disney (DIS). This is why I will use a 9% discount rate for a company like MMM and a 10% discount rate for HAS. In general, most companies I own in my portfolios are valued based on a 9% or 10% discount rate.
However, when I analyze a company and notice they are currently running into difficulties or a challenging environment that is not likely to change in the upcoming years, I will use an 11% discount rate. These companies will show a higher level of risk, therefore, I want more in return. I usually use a 11% discount rate when the company doesn’t meet each of my 7 dividend growth investing principles.
Only on rare occasion, will I use a 12% discount rate. This is very rare as most companies I look at will have to pass several basic search criterion that a “12% discount rate company” would not pass.
Dividend Growth Rate 10 Years
Then, the number that has the least impact on your calculator is the first 10-year dividend growth rate. It has less impact as it is only factored for 10 years compared to the model which values the stock as a never-ending annuity of payments. The 10 year dividend growth rate should be in line with the past 5 years. From time to time, management can decide to give a strong boost to their dividend payments. If this happened over the past 5 years but the numbers continue to add-up (payout ratio under 75%, revenues & earnings on growing trends, etc.), chances are you won’t fail by using similar numbers for the next 10 years.
However, when you value a stock when the market is at an all-time high, don’t expect companies to continue their double digit or high single digit dividend growth rates forever. Ultimately, earnings must follow a similar trend if you want manage to raise their dividend with a 9-12% annual rate. You will agree with me that companies showing such EPS growth rates are pretty rare over the long haul. This is why the terminal growth rate must be lower.
Terminal Dividend Growth Rate
The terminal dividend growth rate is the number that will require you to have some Jedi skills. You need to see far into the future to determine which kind of dividend growth rate the company will demonstrate… forever. This is not the time to be overly excited about the last 5 years of returns of any of your holdings when you trade in an overpriced market. You should become more conservative with your assumptions. As they say, better be safe than sorry!
Here’s one of the most recent examples I have done in terms of valuation. This is the analysis of BlackRock (BLK), the world largest asset manager.
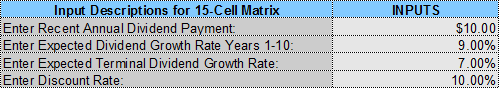
As you can see, I’ve used a 9% growth rate for the first 10 years. The company shows a 8.79% CAGR dividend growth rate over the past 5 years but shows a 48.71% payout ratio. Therefore, there are still lots of room for a 9% dividend growth rate for the next 10 years. On the other hand, I’ve cut the growth rate by 2% to 7% for the terminal figure. Averaging a 7% dividend growth rate is difficult, even for a company like BLK. However, they benefit from strong growth vectors (ETF investing trend, regulations aiming at low fee investment products, etc.) this leads me to think BLK is far from done growing their business.
Finally, while the company’s business model is very strong, it evolves in the volatile financial industry. For this reason, I’m using a discount rate of 10% instead of 9%. A catastrophe on the stock market is always a possibility. Here are the results of my calculations:
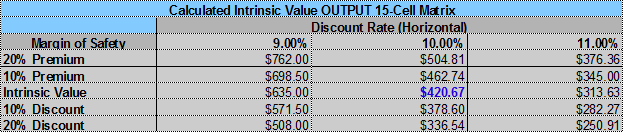
As you can see, even though BLK is trading at a 20.36 PE ratio, there are still room for stock appreciation according to the DDM. I’m not surprised to see there is less than a 10% of margin of safety as the market is very aggressive in terms of valuation.
In an ideal world, I would like to have a margin of safety of 10% to 15% (meaning the stock would trade slightly under $378). Unfortunately, this will not happen when the market is so enthusiast about the future. However, sitting on the sidelines will help you lose more money in “lost opportunities” versus waiting for the next dip. When I find a strong company, I still buy it now as “now” is always the best time to buy.
How About Having these Valuations Done For You?
When I built Dividend Stocks Rock, I wanted to build a platform where dividend investors would save time without giving up quality. The key word here is efficiency. I bet you are quite busy managing your life as it is, maybe managing your portfolio has been a bit overwhelming and some information is falling into the cracks.
This is why we follow over 70 strong dividend growth companies and we have stock cards including graphs, analysis and valuations for each of them.
These stock cards can be downloaded in PDF format and are updated annually. You can then pick among the companies we pre-screened and analyzed for you and cut through most of your analysis process in a second without losing any quality.
What’s the best part? We regularly do stock cards upon members’ requests. In other words, we really do these valuations for you!
Interested?
Click here to learn more about our services and the special price I have for you
Cheers,
Mike