
In September of 2017, I received slightly over $100K from my former employer which represented the commuted value of my pension plan. I decided to invest 100% of this money in dividend growth stocks.
Each month, I publish my results on those investments. I don’t do this to brag. I do this to show my readers that it is possible to build a lasting portfolio during all sorts of market conditions. Some months we might appear to underperform, but you must trust the process over the long term to evaluate our performance more accurately.

Performance in Review
Let’s start with the numbers as of April 4th, 2022 (before the bell):
Original amount invested in September 2017 (no additional capital added): $108,760.02.
- Portfolio value: $219,612.22
- Dividends paid: $4,054.81 (TTM)
- Average yield: 1.85%
- 2021 performance: +16.78%
- SPY= 28.75%, XIU.TO = 28.05%
- Dividend growth: +3.14%
Total return since inception (Sep 2017- March 2022): 102%
Annualized return (since September 2017 – 54 months): 16.91%
SPDR® S&P 500 ETF Trust (SPY) annualized return (since Sept 2017): 16.47% (total return 98.56%)
iShares S&P/TSX 60 ETF (XIU.TO) annualized return (since Sept 2017): 12.65% (total return 70.90%)
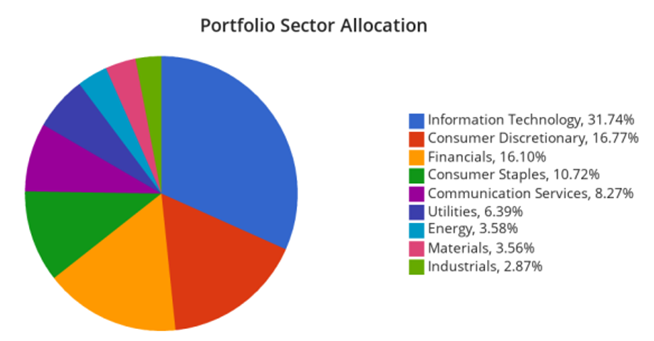
Sector allocation calculated by DSR PRO
More Trades
You probably saw this coming from my previous portfolio update. I am about to make some trades! I’m not the type of investor who will readily bounce from one stock to another. In fact, it’s quite the opposite. I spend several hours of quality time analyzing companies before I make an investment decision.
Unfortunately, time changes, the business environment evolves, and companies take different turns. In other words, no matter how much time you put into your analysis, your investment thesis could turn wrong. This is pretty much the story of one of my stocks.
Adios Andrew!
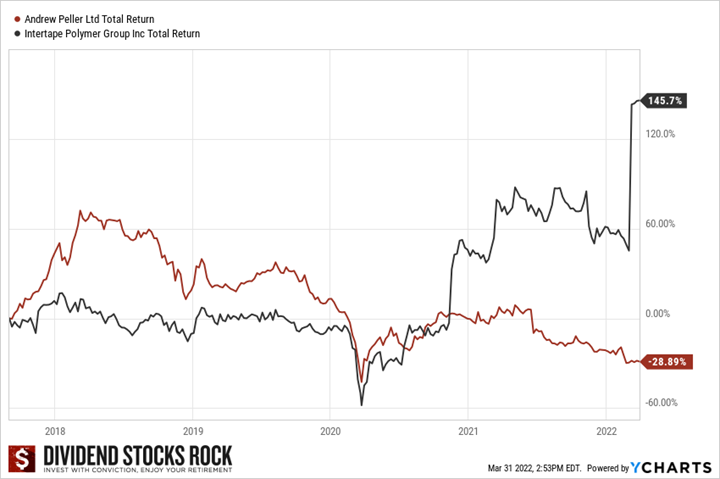
Last month, I decided I had enough of Andrew Peller’s (ADW.A.TO) weak growth. One of the reasons why I bought shares in this company in 2017 was its growth by acquisition strategy. Andrew Peller is a dominant player in the wine industry, and it enjoys economies of scale and can sell its products through its own distribution network. Since ADW operates in a fragmented market, buying more vineyards to support growth is a smart business model. Unfortunately, they put the break on this strategy in 2019 and never went back to it (maybe due to the pandemic). The result for my portfolio was terrible. After surging more than 60% in 2018, the stock started to decline shortly after and never stopped the bleeding. I sold at a loss of ~28% including dividends! At the beginning of March, I sold my 586 shares at $7.237/per share.
But I made my peace with it, and I have chosen to invest in a thriving business going forward!
Adios Duct Tape ?
Speaking of thriving businesses, the acquisition of Intertape Polymer (ITP.TO) more than compensated for the losses incurred with my Andrew Peller shares. Intertape Polymer’s (ITP.TO) stock surged on a big announcement on March 8th: it will be acquired at $40.50 per share!
Read more here.
Since the stock went up above $39 and the transaction is expected to close in Q3, I didn’t wait long and decided to take the money and run. Shares have been trading around $39.50 since the announcement, leaving a 2.5% upside potential (plus dividend) until the transaction closes. A day or two after the announcement, I sold my 128 shares at $39.20 for a ~140% total return.
Sometimes you win… sometimes you lose…
Welcome Granite!
If you have been a follower for a while, this transaction will not surprise you. I have often mentioned Granite REIT (GRT.UN.TO) being my favorite REIT. For some reason, I never got a chance to add it to my portfolio (great opportunities are often infinite while my investment wallet is finite!). I bought 128 shares at $91.70.
GRT used to be an extension of Magna International (MG.TO). In 2011, Magna represented about 98% of its revenues. It is now down to 29% as at December 2021 (with Amazon as its second-largest tenant with 5% of revenue). Management has transformed this industrial REIT into a well-diversified business without adversely affecting shareholders. GRT now manages 122 properties across 7 countries. The REIT also boasts an investment grade rating of BBB/BAA2 stable. With a low FFO payout ratio (around 72%), shareholders can enjoy a 3%+ yield that should grow and match or beat the inflation rate. This is among the rare REITs exhibiting AFFO per unit growth while issuing more units to finance growth. Let’s just say that Granite’s profile is a lot stronger than Andrew Peller’s.
More Renewable Energy!
With the remaining cash in the account, I fueled my portfolio with more renewable energy (pun intended). At the beginning of March, I bought 99 shares of Brookfield Renewable Energy (BEPC.TO) at $48.42. I already had a few shares of BEPC in my portfolio as I previously used dividend payments from other companies to start a position in this company.
What I mean by “starting a position” is that I prefer to have equally-weighted positions in my portfolio. Therefore, since I have 21 different companies in my portfolio, the goal is to have 4-5% weight in each of them. Since some of my stocks have surged since the creation of my portfolio in 2017 (hello Apple, Microsoft, Visa and BlackRock!), my money isn’t spread equally across all my holdings. I’m using dividend payments to rebalance some positions here and there. I usually don’t do “half position” trades as I did with BEPC, but I really wanted to get in that stock and since I can’t add capital to this account (it’s a locked-in retirement account), I had to start with cash generated by the portfolio.
The future of energy will be found in hydroelectric, solar, and wind power. 64% of BEPC’s portfolio is focused on hydroelectric power. The company has power plants in North America, South America, Europe, and Asia. BEPC enjoys large-scale capital resources and the expertise to manage its projects across the world. Management aims at a 5-9% annual distribution increase. What will happen in the coming years is more money will be going toward those projects. Investors are following the green trend and BEP is well-positioned to attract them.
After this transaction, BEPC is now 3.50% of my portfolio. It’s still a small player and I will likely continue to increase my position with future dividend payments. There is nothing better than boosting your exposure to such a strong dividend grower!
Below are more ideas in the Renewable industry.
Additional thought: Alimentation Couche-Tard doesn’t get the love it deserves
During my latest portfolio update, most of my Canadian stocks reported their earnings, but Couche-Tard was late to the party. While ATD is trading at an all-time high, I continue to believe it doesn’t get the love it deserves from the market. The stock is trading at a P/E below 19 and its latest quarterly earnings showed EPS up 27% and revenue up 6%. The increase was primarily driven by same-store merchandise sales which increased by 3.7% in the U.S., 7.2% in Europe and other regions. Same-store sales dropped 0.8% in Canada. Driving higher revenues was the higher average road transportation fuel selling price and demand. Merchandise and service gross margins increased 1% in the U.S. to 33.6%, 0.2% in Canada to 31.6%, and decreased 0.7% in Europe and other regions to 37.8%, which was impacted by the integration of Circle K Hong Kong.
Let’s look at my CDN portfolio. Numbers are as of March 4th, 2022 (after the market close):
Canadian Portfolio (CAD)
| Company Name | Ticker | Market Value |
| Algonquin Power & Utilities | AQN.TO | 6,620.67 |
| Alimentation Couche-Tard | ATD.B.TO | 20,269.14 |
| National Bank | NA.TO | 11,631.73 |
| Royal Bank | RY.TO | 8,293.80 |
| Brookfield Renewable | BEPC.TO | 7,542.09 |
| CAE | CAE.TO | 6,856.00 |
| Enbridge | ENB.TO | 9,378.25 |
| Fortis | FTS.TO | 6,225.12 |
| Magna International | MG.TO | 5,639.90 |
| Sylogist | SYZ.TO | 3,982.35 |
| Granite REIT | GRT.UN.TO | 11,976.96 |
| Cash | 139.45 | |
| Total | $98,555.46 |
My account shows a variation of +$9,802.07 (+11%) since the last income report on March 3rd. In my previous edition, I discussed how market corrections shouldn’t impact your perception of your portfolio. Once again, time worked in my favor and the overall portfolio is getting close to its all-time high. It doesn’t mean it can’t go down in the future, but I would rather let it work and pay dividends.
Here’s my US portfolio now. Numbers are as March 4th, 2022 (after the market close):
U.S. Portfolio (USD)
| Company Name | Ticker | Market Value |
| Activision Blizzard | ATVI | 9,364.68 |
| Apple | AAPL | 13,383.00 |
| BlackRock | BLK | 10,951.22 |
| Disney | DIS | 6,236.10 |
| Gentex | GNTX | 6,822.05 |
| Microsoft | MSFT | 17,323.35 |
| Starbucks | SBUX | 7,487.65 |
| Texas Instruments | TXN | 9,135.50 |
| VF Corporation | VFC | 4,611.33 |
| Visa | V | 11,387.00 |
| Cash | 306.50 | |
| Total | $97,008.38 |
The US total value account shows a variation of +$3,619.77 (+3.88%) since the last income report on March 3rd. Like what happened to my Canadian portfolio, the U.S. portfolio went back up nicely over the past 2-3 weeks. There have not been any changes for this portion of the portfolio.
My Entire Portfolio Updated for Q1 2022
Each quarter, we run an exclusive report for Dividend Stocks Rock (DSR) members who subscribe to our very special additional service called DSR PRO. The PRO report includes a summary of each company’s earnings report for the period. We have been doing this for an entire year now and I wanted to share my own DSR PRO report for this portfolio. You can download the full PDF showing all the information about all my holdings. Results have been updated as of March 2022.
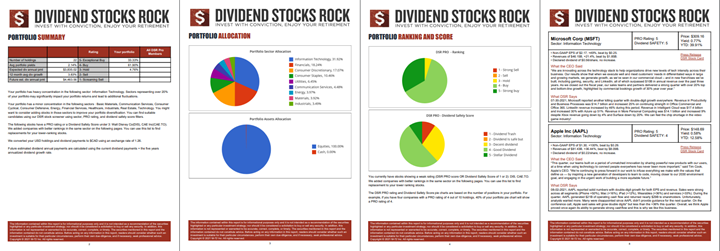
Download my portfolio Q1 2022 report.
Dividend Income: $501.92 CAD (-19.5% vs March 2021)
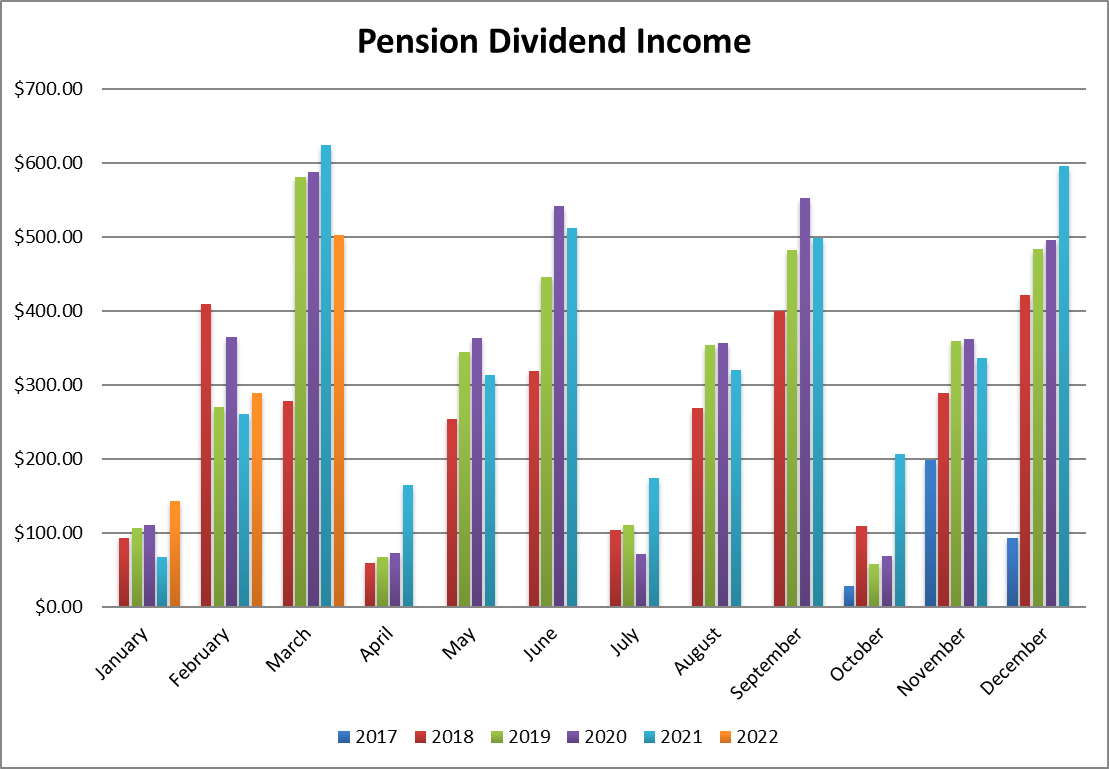
This is what happens when you trade in your portfolio! My dividend income took a severe hit this quarter because last year, I received payments from Lazard and Intertape Polymer. I would have received a larger amount from Microsoft, but I also sold some shares to rebalance my portfolio in December. Finally, I took a 1.5% currency hit as the USD/CAD conversion rate was 1.2624.
Besides Sylogist, all my other holdings show a dividend increase vs last year.
Here is the detail of my dividend payments.
Dividend growth (over the past 12 months):
- Fortis: +6%
- Enbridge: +3%
- Magna International: +6.1%
- Sylogist: 0%
- Brookfield Renewable: new dividend
- Visa: +17%
- Microsoft: +1.5% (I sold some shares)
- VF Corp: +2%
- BlackRock: +18%
- Currency factor: -1.5%
Canadian Holding payouts: $283.10 CAD
- Fortis: $52.97
- Enbridge: $138.46
- Magna International: $39.54
- Sylogist: $52.13
- Brookfield Renewable $17.07
U.S. Holding payouts: $161.67 USD
- Visa: $18.75
- Microsoft: $34.10
- VF Corp: $40.50
- BlackRock: $68.32
Total payouts: $484.85 CAD
*I used a USD/CAD conversion rate of 1.2479
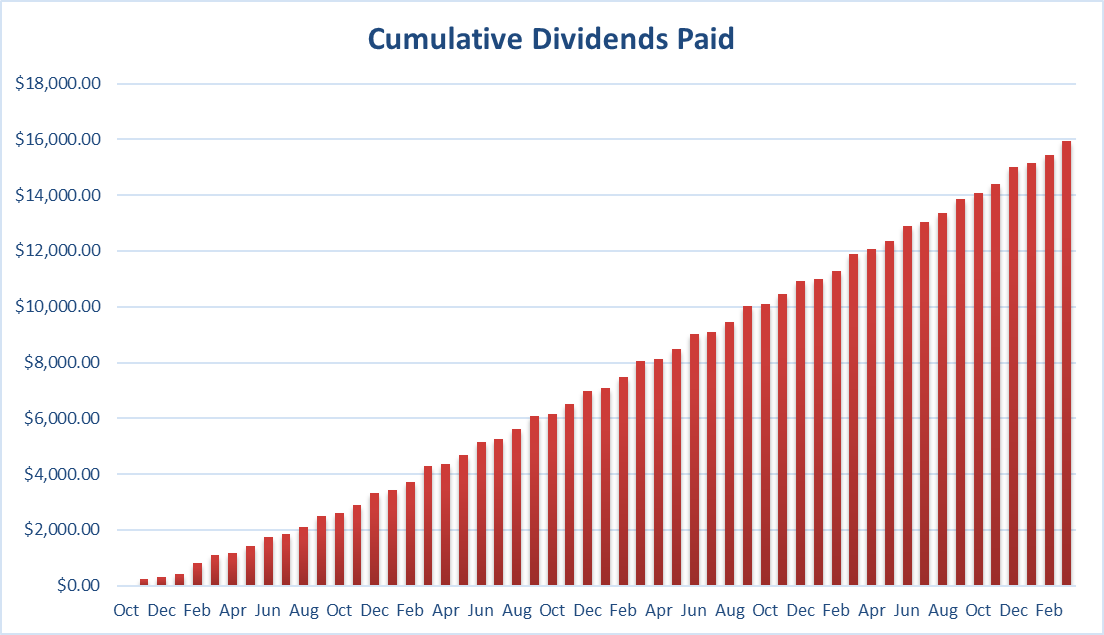
Since I started this portfolio in September 2017, I have received a total of $15,944.01 CAD in dividends. Keep in mind that this is a “pure dividend growth portfolio” as no capital can be added into this account other than retained and/or reinvested dividends. Therefore, all dividend growth is coming from the stocks and not from any additional capital being added to the account.
Final Thoughts
Big update on a personal level. Since I turned 40 about six months ago, I started to have more thoughts about building assets at a faster pace for the next decade. My financial plan is well on its way, but I like a challenge and see wealth creation as a worthwhile hobby.
Therefore, I will start a Smith Manoeuvre portfolio in April. The Smith Manoeuvre has been popularized by a financier named Fraser Smith who found a way through leverage to make Canadians’ mortgage interest tax-deductible. Leverage isn’t for everyone, but I’ll share my plan to invest in dividend growth stocks by using a home equity line of credit.
Cheers,
Mike.
The post More Trades – March Dividend Income Report appeared first on The Dividend Guy Blog.