
Warning: I really wanted to name this article “Financial Split Corp Bashing,” but I thought it would be nicer if you read the words “explained” instead. Jokes aside, I find there are some major issues investors decide to ignore (or just don’t know) when they look at an investment paying a 14% yield. Starting with this kind of reaction:

All right, how about we jump in a fairy tale book where I can invest all I have and get a 14% yield each year? How incredible is it? To be honest, not so much. In fact, Financial Split Corp isn’t that attractive once you dig deep enough.
Split Share explanation
First, let’s come back to what a split share is in the first place. I’ve already wrote about split corps back in 2015. While this article is about Financial Split Corp, let’s revisit what I mentioned about The Dividend Split 15:
“The Dividend 15 Split Corp is able to generate such high yield because it is a structured product; a clever mix of shares and options that produce high returns… for the brokers. These products show lots of smoke to the investors but are built to generate generous commissions to any broker selling them. This is why these products make it on the market anyway.
As the company’s portfolio doesn’t generate enough to pay a 10% yield and cover the firm’s management fees, the remaining cash has to be found elsewhere. Since this portfolio would generate around 5% dividend yield, the mutual fund company (yes, DFN is in fact a mutual fund company) trades the underlying securities and writes call options on them too. These operations also trigger additional costs to the investors as even performance bonuses for traders are included in the ‘creation of wealth process.”
During my discussion on Twitter, a follower pointed me to this great resource to understand the full mechanism behind split corps in general:
What it means in your portfolio
Now that you know a little bit more, you may want to jump the gun and buy those shares to receive the juicy 14-15% yield. The best part is that Financial Split Corp pays monthly!! So… how about a nice 15% payment? Let’s take a look at what happened for an investor in the past 10 years.
Financial Split Corp Class A share
I was quite disappointed to find that I can’t get the data from the Financial Split Corp Class A share on Ycharts. I had to go on TMX and get the following graph for the past 10 years:
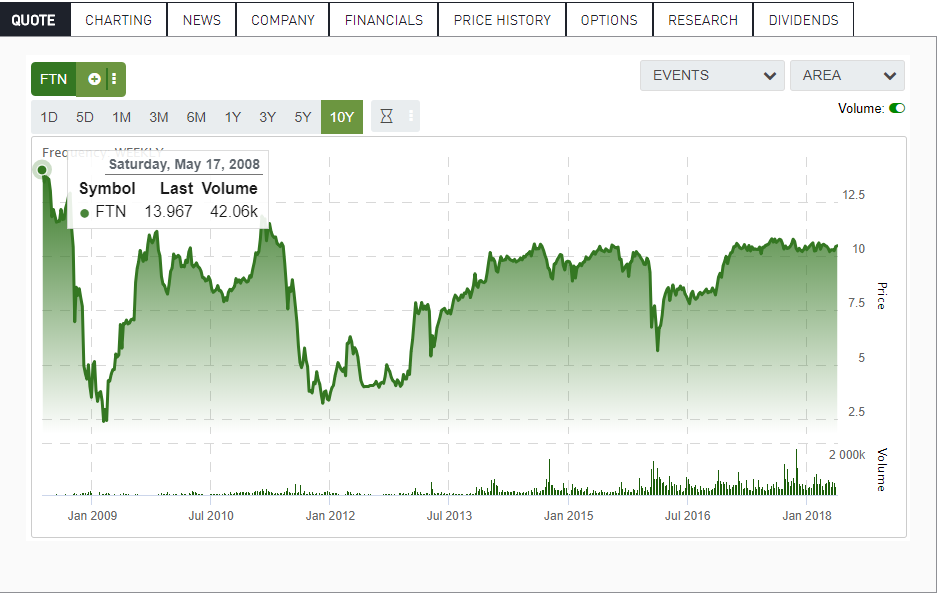
Source: TMX
At the moment of writing this article, the opening price for FTN.TO on May 15th was $10.45. In other words, if you had bought FTN.TO 10 years ago at $13.97, your shares would be showing a negative result of -$3.52 or -25.19%. But who cares about -25% when you got paid 15%/year during all this time, right? Oops, Financial Split Corps Class A shares also took a “pause” of dividend for 18 consecutive months between 2011 and 2012. So much for a stable source of income!
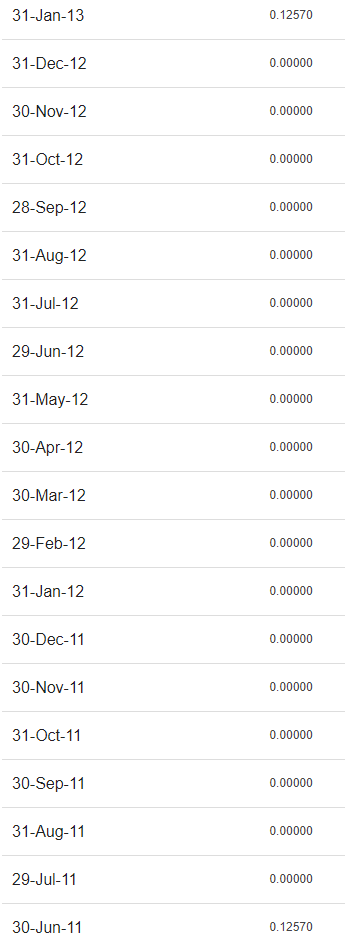
Source: Quadravest website
Now, let’s recapitulate what really happens in your portfolio.
- You bought shares at $13.97 10 years ago.
- You received (120 – 18= 102 months with a payment of $0.1257) = $12.82 per share.
- Your shares are now worth $10.45.
If you sold your investment on May 15th in the morning, you received $10.45 + $12.82 during all those years for a total of $23.27.
Your initial investment was of $13.97 per share, therefore, your return in 10 years was (23.27/13.97) = 66.57%. Not bad. This is the equivalent to an annualized rate of return of 5.23%. I can’t say that a 5.23% CAGR over the past 10 years is a bad investment per se. After all, the Financial Split Corp went through the 2008 crisis with success.
But if you want to know if you made a good deal, you must dig a little further and consider other types of investments.
What were your other options?
My first thought when I searched for a comparison was to check against the overall market. I pulled out the XIU (TSX 60 ETF) and checked its total return over the past 10 years. I was surprised, but Financial Split Corp generated about 20% more in return. To be fair, the TSX 60 includes energy and resources companies that didn’t do very well in the past few years. Since the financial sector quickly bounced back from the 2008 crisis (as those companies didn’t suffer as the US ones), this mostly explains why one investment beat the other.
As a dividend growth investor, I thought comparing it to a dividend ETF which would be a better choice for comparison. I usually benchmark my performances against the XDV.TO – iShares Canadian Select Dividend ETF. In that case, Financial Split Corp underperformed XDV.TO by 10%. This is not an incredible difference, but if I have the choice between a complex financial product using options and a simple to understand ETF, I’ll choose the later.
Finally, I thought of comparing the Financial Split Corp with what I would have really done 10 years ago; pick a few Canadian banks! I’m not cherry picking here because this is exactly what I would have done to match my performance against another investing product geared toward the financial sector. Here’s the result:
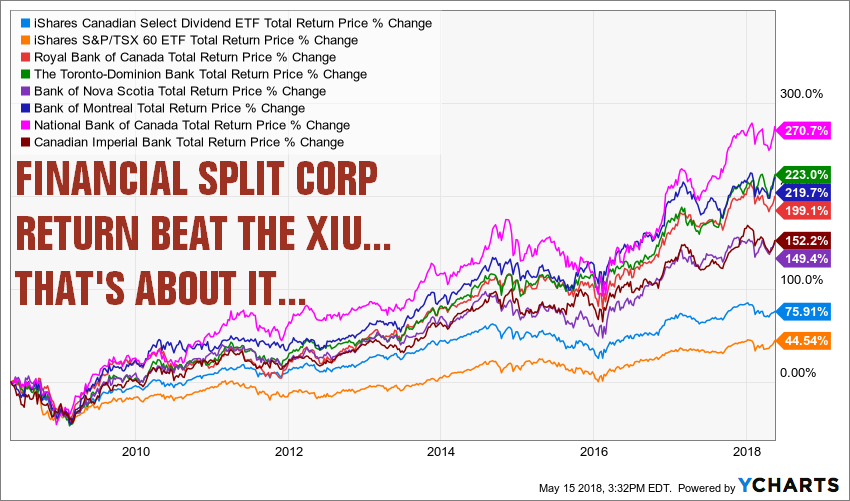
Source: Ycharts
As you can see the Financial Split Corp is showing a very poor performance against any Canadian banks. In fact, there is no close comparison between banks (return between 150% and 270%) and Financial Split Corp class A shares.
Classic counter arguments in favor of the Financial Split Corp
I know that some investors will come with counter arguments. After all, split corp shares look very attractive when you are looking for income. Here are the most common points I’ve heard so far… and my answer.
Have you considered reinvesting the dividend?
It would not change the fact that banks and XDV will outperform. If you reinvest money in an underperforming investment vehicle, it will not outperform others. In fact, since the bulk of the return has been generated from shares appreciation for banks and the XDV, the dividend reinvestment would create a larger difference in their favor.
You simply don’t understand how it works.
That’s a classic statement when you hit the nail. I do understand how split corp are made. The thing is that most investors don’t understand that the magical yield is generated by writing options which is far from being a successful strategy all the time (remember the 18 months with NO dividend FTN had?).
But the 15% yield is my source of income, I don’t want share appreciation.
I’m sorry, but you are completely wrong. The problem with this product is that your distribution is getting eaten alive by inflation. Have you noticed how the dividend payment hasn’t move by an iota since 2008? Therefore, if you had invested your money into Financial Split Corp 10 years ago to generate 40K/year, you are making exactly the same 40K today. Your buying power has eroded year after year. Even worse, you spent 18 months with absolutely no income. Therefore, FTN was our income source, you had no other choices but to sell shares at one point in time. If you look back to the first graph, you will notice how FTN lost more than 50% of its value on the market when the dividend was paused.
Conclusion for a 12-year old
To make it very clear: there is no free lunch in finance. If an investment offers you the moon, there are also risks being taken into consideration. Such products also look amazing when the market is hyped and the economy is growing. Do you remember what happened with mortgage-backed securities and commercial papers? Exactly my point. Wonderful products… until we hit the end of the bubble. My choice? Picking dividend growth stocks.
The post DGB Financial Split Corp Explained Inside Out appeared first on The Dividend Guy Blog.