About a year ago, I was about to receive a big fat check of $108K from my former employer’s pension plan. I decided to manage this money and build my own retirement portfolio following my dividend growth investing strategy. A lot of investors on this blog were sceptic about my decision.
Why would you invest all your money at the top of the market? They said.
I even went a little further. Since I saw lots of interest from you guys, I decided to publish my portfolio and update it month after month. On August 1st, my portfolio was showing a total value of $133,882.65. In less than a year, I made over $25K in profit. As of August 10th, my returns were even a little better as the earnings season is going well!
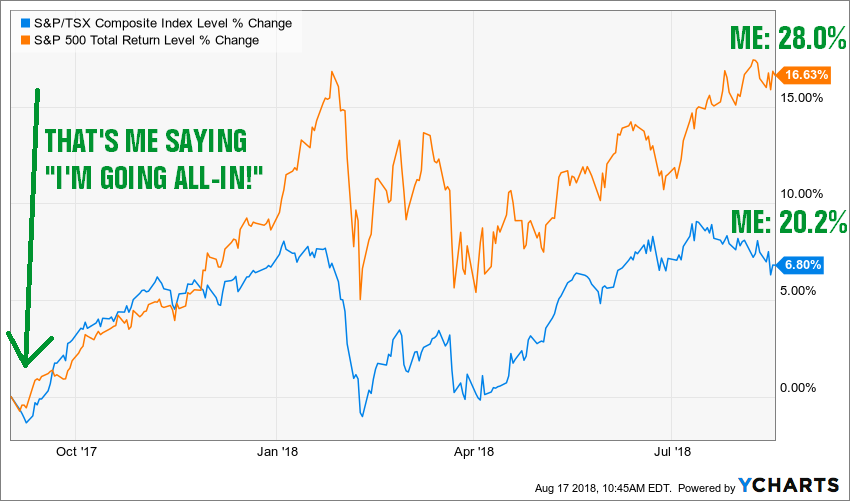
Source: Ycharts
I’m not posting those numbers to brag, I just want to show that you can invest in the market even when the valuation is through the roof and that the crash is imminent. Imagine if the stock market drops by 30% in the next three months. My portfolio would fall around 93K and I would be left with a “hole” of 15K compared to what I invested. It wouldn’t be that bad. Plus, each day going forward, my “worst case number” is slightly going up.
I wasn’t worried when I started investing this money and I am still not worried at all. The reason is quite simple; I’ve invested in companies that show bulletproof numbers in various metrics. As I can’t control what’s going on the market, I rather pick companies with these strong metrics. I know that if they show this solid core of metrics, they will go through the next storm and I’ll end-up a richer investor in the end.
Revenue
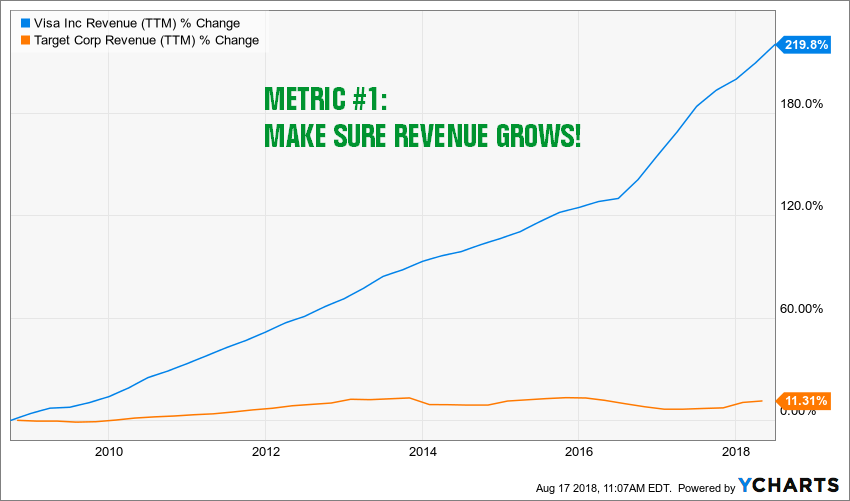
The Revenue trend is the first stepping stone of my dividend triangle approach. The first thing I want from my investment is a company that is growing. Sounds quite obvious to you? Well the market is filled with poor revenue growth companies. Would you rather invest in Visa (V) or in Target (TGT)?
Source: Ycharts
I obviously picked two extreme situations showing mediocre revenue growth (Target) vs incredible revenue trend (Visa). I’m well aware not all my holdings will be showing double-digit revenue growth for the past 10 years (and upcoming 10!). But companies that on such a roll are able to go through a storm. The revenue grow will decrease, but imagine what will happen to Target if their revenue CAGR was below 1% over the past 10 years when we hit a recession…
Earnings
Once I have found companies that are showing steady revenue growth, the second thing I want is to find companies making money out of those sales. This is a bit tricky since many factors are included in earnings and some of them don’t include real money! Since earnings are calculated using accounting principles (GAAP), we often get misled when looking at some graph:
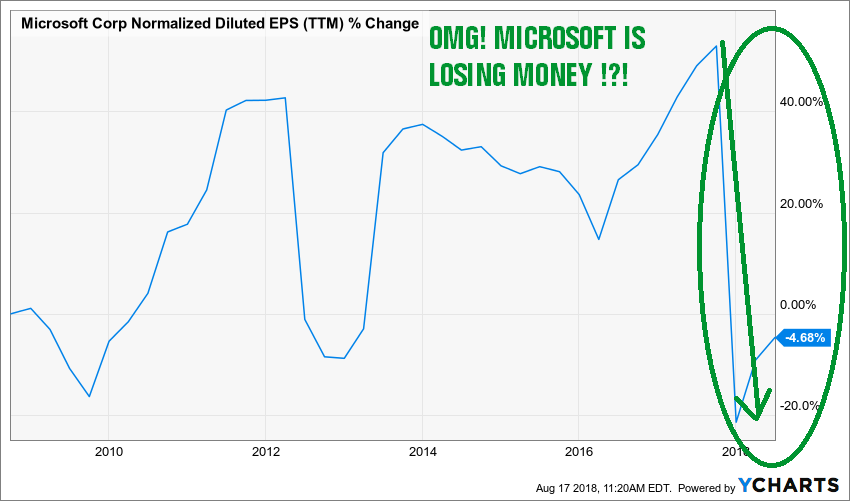
Source: Ycharts
Do you really think Microsoft has a very bad 2018 where earnings dropped down the hole? Nah! I’m just kidding! You may be surprised that when you take out all the accounting “noise” around MSFT’s earnings, the company actually reported a non-GAAP EPS growth of 15% last quarter and beat analysts expectation by $0.05 (July 2018). You didn’t know that? Maybe you should think of using DSR PRO then ?.
Companies with a stronger earnings trend have a better chance of building a safety net for a challenging period. Chances are they will recuperate faster during the next crash as well. Strong revenue uptrend should lead to better earnings. Once you have both factors together, the next one should be dividend growth!
Dividend
The first two metrics are useful only if they lead to the peak of the dividend triangle; dividend growth. Many researches throughout the past 50 years have been conducted on dividend growers vs other companies. All of them show that dividend growers are among the best in kind on the market. Then again, the market will crash, I can’t do anything about it. However, I can pick companies that will not only keep their dividend alive, but will also keep increasing it.
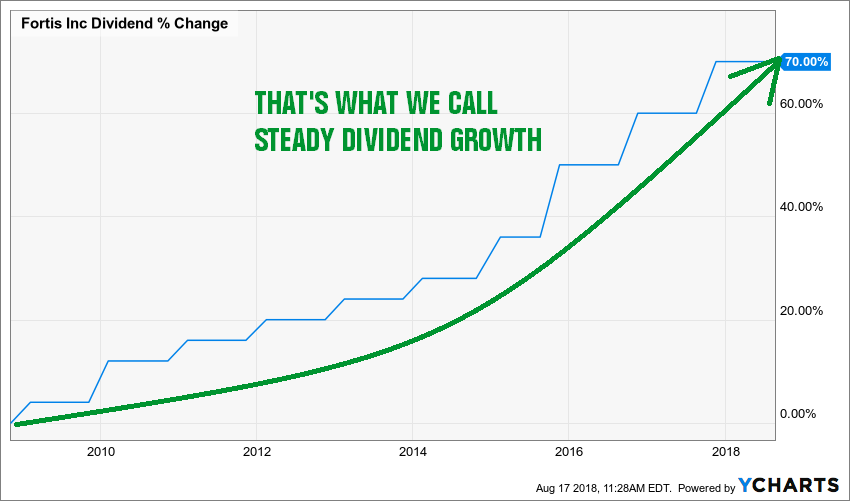
Source: Ycharts
Fortis (FTS.TO) is a very boring stock with limited hype around it. However, I’m getting very excited when I see a steady dividend growth rate over more than 10 years like this one. Not all my holdings show such impressive consistency, but most of them show a 10 years+ dividend increase streak. I like getting paid during market downturns.!
Debt
If you really want to go bullet proof against the next market crash, another metric you must include is the company’s debt level. In an ideal situation, I want companies that are currently paying their debts. During a bullish market, many companies use leverage to acquire competitors, spend in R&D or any other strategies to grow their business. This is good as long as there is an appetite for debt on the market. When the lights go out, debt hungry companies may feel a huge hangover.
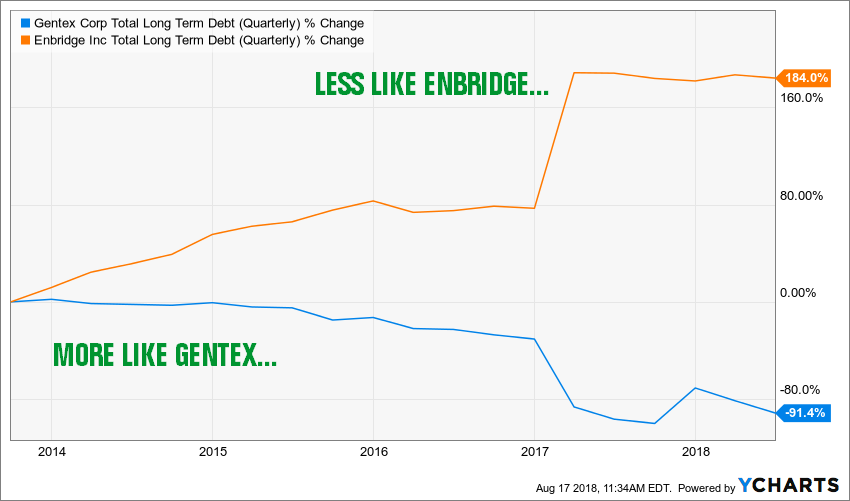
Source: Ycharts
This is why I tried to pick companies more like Gentex (GNTX). However, I did invest in Enbridge (ENB.TO) too, mostly due to the fact that the stock was in a slump and the dividend payment was promising. The point was not to aim at too many companies in ENB’s situation and find more like Apple (AAPL), Gentex and Microsoft.
Payout Ratios
Technically, if you have picked companies with growing revenues, growing earnings and growing dividend, their payout ratios should look good. However, as the regular payout ratio is based on earnings (and we just saw how this works out!), the number you are looking at might be misleading. For this reason, I also use the cash payout ratio to make sure the company has plenty of cash to distribute its dividend.
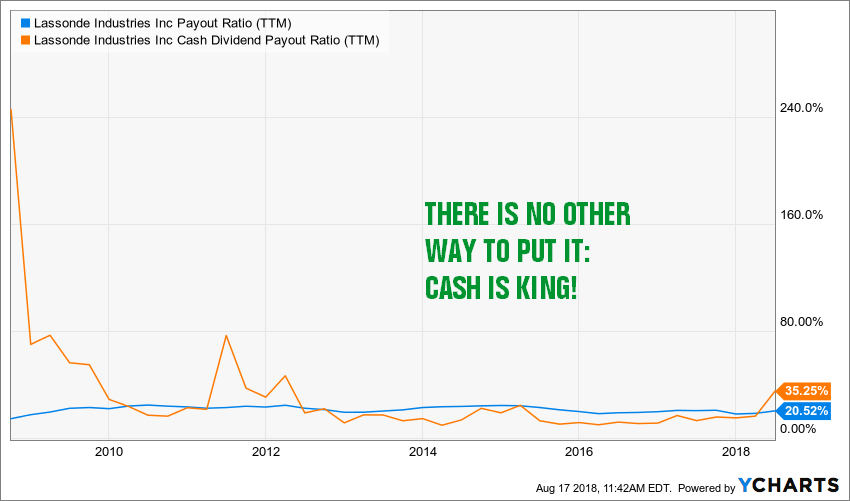
Source: Ycharts
Companies with low payout ratios are likely to keep up with their dividend growth policy even if it goes through a recession. Since my whole investing strategies is based on dividend growth investing, making sure companies can increase their dividend year after year is crucial, right?
There are many particularities around the payout ratio calculations. I’ll be hosting an exclusive webinar on how to see through this accounting mess and determine stock’s dividend safety score in September. But that will be for Dividend Stocks Rock members only…
Valuation? What Valuation?
Haven’t you noticed I just wrote a 1,000+ word article about investing at the tip of a bull market without talking about valuation methods? It’s because valuation doesn’t matter. Tell me the opposite, and tell me that you knew that the market wasn’t overvalued in (pick your year):
2015
2016
2017
And shortly 2018.
I recently received an email from a reader telling me he kept 70% of its portfolio in cash since 2015 because this was the “year of the crash”. It didn’t happen and he is still in doubt about when he should invest.
I decided to get rid of the doubt and focus on other strong metrics. When I invested my money last year, my goal wasn’t to tell you that I’m richer today. My goal is to be richer in 10, 25, 30 years from now. This is why the next crash won’t matter if you have selected your companies based on bullet proof metrics!
Disclaimer: I’m long V, MSFT, FTS.TO, GNTX, ENB.TO, AAPL. LAS.A.TO
The post 5 Bullet Proof Metrics to Follow for All Investors appeared first on The Dividend Guy Blog.